Is my component thermally safe?
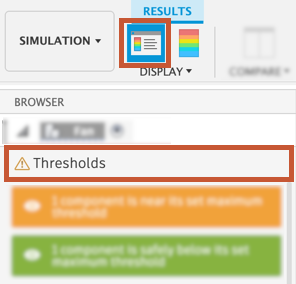
The Thresholds Guided Result is shown by default when you first enter Results and requires that you define the maximum temperature threshold for each component of interest in the study setup, before solving.

Results interpretation
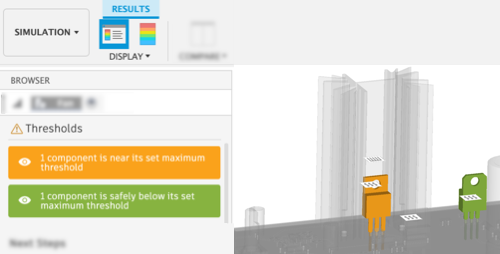
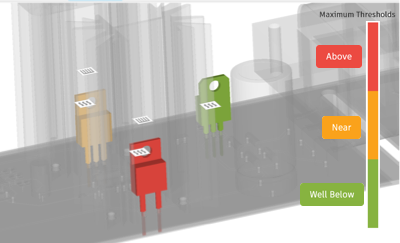
The top section of the Guided results interprets the Thresholds result and tells you whether or not your component is below its maximum temperature threshold. The colors on the model match the colors in the guided results and the legend, to make the distinction clear.

There are four possible outcomes from a Thresholds result that indicate the likelihood that a component will remain below its maximum temperature threshold:
Red - the temperature of the component exceeds the temperature threshold,
Yellow - the temperature of the component is below, but within 20% of, the temperature threshold
Green - the temperature of the component is more than 20% below the temperature threshold
No color - the component is missing a maximum temperature threshold in the study setup.

Click on the interactive legend to ghost components so you can focus on problem areas. The length of each colored section on the legend reflects the ratio of components with temperature thresholds that fall into that category.
Next Steps
The bottom half of the guided results panel provides you with options to try to increase the likelihood that the components will remain below their respective maximum temperature thresholds. Each of the recommendations is based on electronics cooling best practices and the study settings for the specific study.
Changing one parameter, such as adding a heat sink or reversing the flow direction of the fan, may improve the temperature of one component, yet have an adverse effect on another. Adjusting the parameters, therefore, is often simply an iterative process.
Tips
- Next steps are listed in order of increasing difficulty.
- Next step are grouped into those that can be performed in the Simulation workspace, and those that should be done in the Electronics workspace.
- If you decide to modify your model, clone and modify the Simulation model to test out different modifications so you don't alter your original design unnecessarily.