Injection molding process study log
During the injection molding simulation data is written to a log file for you to view. By default, the data is presented in an instructional overview format which shows you the data in the context of the injection molding process. You can also see the data in standard Table format.
Overview format
In this format, the data is summarized for you, and you can learn how it correlates to the different phases of the injection molding process.
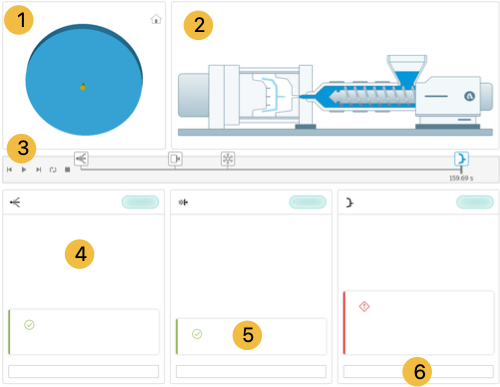
In the Overview of the study data, you can animate the process and view the data as it changes with time. You can also see the Guided Results interpretations and access the Guided Results for Next Steps suggestions.
Molding Process Overview:

where 1. Part filling animation, 2. Injection molding process animation, 3. Animation controls, 4. Data categorized into different injection molding phases, 5. Results interpretations, 6. Link to Guided Results
Table format
In Table format, the study data is presented in tabular form and shows how the following data change with time:
- % Volume filled
- Pressure
- Flow rate
- % Frozen volume
- Status of the fill control (Velocity vs Pressure)