Maximum Thresholds result
The Maximum Thresholds result shows which components have exceeded their maximum temperature thresholds, and which components are below. You define the maximum temperature threshold for each component of interest in the study setup, before solving. By assigning a Temperature Threshold value to the components, the Maximum Thresholds result highlights only those components, and lets you know whether they are below, approaching, or above the temperature threshold, so you can take action.
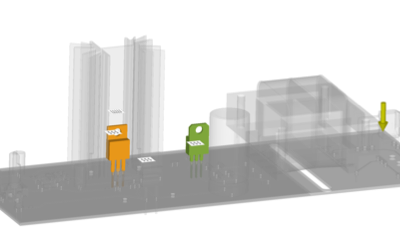
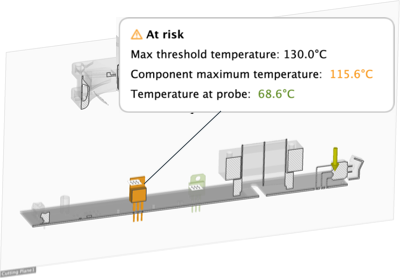
Figure 1 showing a model in which two components have set maximum temperature thresholds.
Things to look for
When viewing the Maximum Thresholds result, watch for the following:
Red - the temperature of the component exceeds the temperature threshold,
Yellow - the temperature of the component is below, but within 20% of, the temperature threshold
Green - the temperature of the component is more than 20% below the temperature threshold
No color, when you expected to see color - the component is missing a maximum temperature threshold in the study setup.
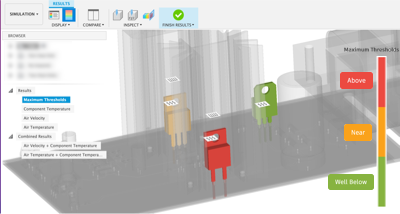
Figure 2: Thresholds result showing the two components that have a Temperature Threshold assigned to them.
Using this result
Use this result in conjunction with other results, to understand what is impacting the component temperatures
Click on the interactive legend to ghost components so you can focus on problem areas. The length of each colored section on the legend reflects the ratio of components with temperature thresholds that fall into that category.
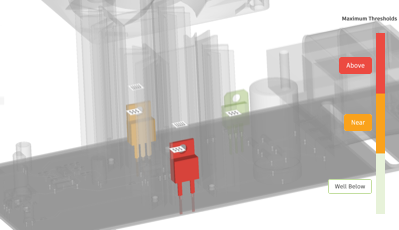
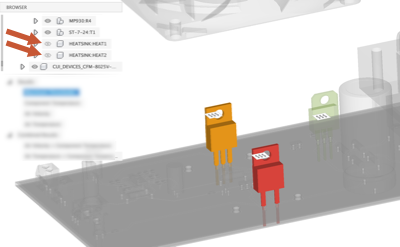
Hide a component on the board, for example if it's masking a component of greater interest, by toggling its
 visiblity in the Model components folder.
Use Surface probes, Point probes, and Cutting planes to inspect the result carefully.
Next Steps
To address the potential issues highlighted by the Maximum Thresholds result, you could:
- Switch board components for different ones that can tolerate higher temperatures
- Select a component that meets the performance requirements but requires a lower internal heat load
- Change the dimensions or material used in the heat sink
- Add a fan, if there isn't one
- Change the location of the fan to move the fluid flow path away from heat sensitive components
- Reverse the blowing direction of the fan.