Activity 5: Solve and review the results
In this activity, you solve the study. After the study has completed, and all incremental results have downloaded, you then inspect the results to see how the billet responded to the crushing load. In this review of Study 1- Quasi-static Event Simulation results, you
- Solve the study
- Display the Displacement and Strain results to view the tension and compression experience by the Billet as it is crushed
- Animate the Displacement and Strain results to simulate how the Billet changes throughout the event.
Prerequisites
- Activity 4 is complete.
Steps
Solve the study.
Click
 (Simulation workspace > Setup tab > Solve panel > Solve) to open the Solve dialog.
Click Solve 1 Study to begin the solution process.
This model takes about 20–30 minutes to upload, solve, and download the results. The total time depends on the speed of your Internet connection and the level of concurrent solution activity on the cloud.
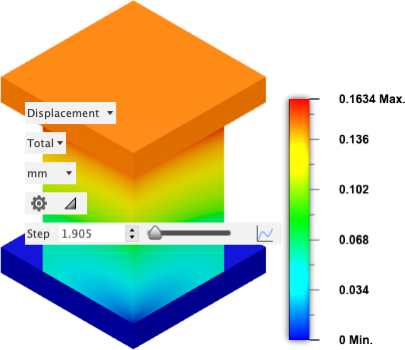
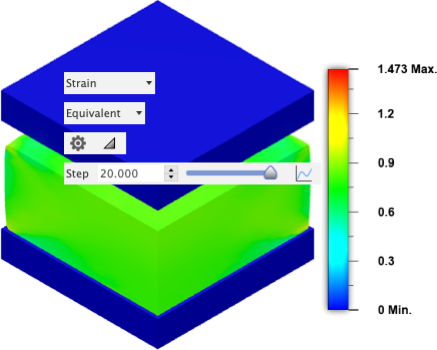
View the Strain and Displacement results to examine how the billet responds as it is crushed into the Rigid bottom plate.
As the billet is crushed, it bulges outwards towards the vertical edges of the stationary base plate. The inside bottom corner is prevented from moving, both by the stationary base plate and also by the surrounding copper of the full model.
Click
 (Simulation workspace > Setup tab > Results panel > Simulation Results), to open the Results environment.
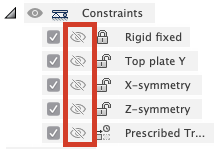
In the Browser, click each of the eyes to the left of the constraints, to hide all the constraint glyphs so they don't interfere with your examination of the results.

Using the results selector associated with the legend bar, change from the Stress result to the Displacement result.
Drag the slider next to the Step field to see how the displacement varies during the event.

Switch to the Strain result and repeat the process.

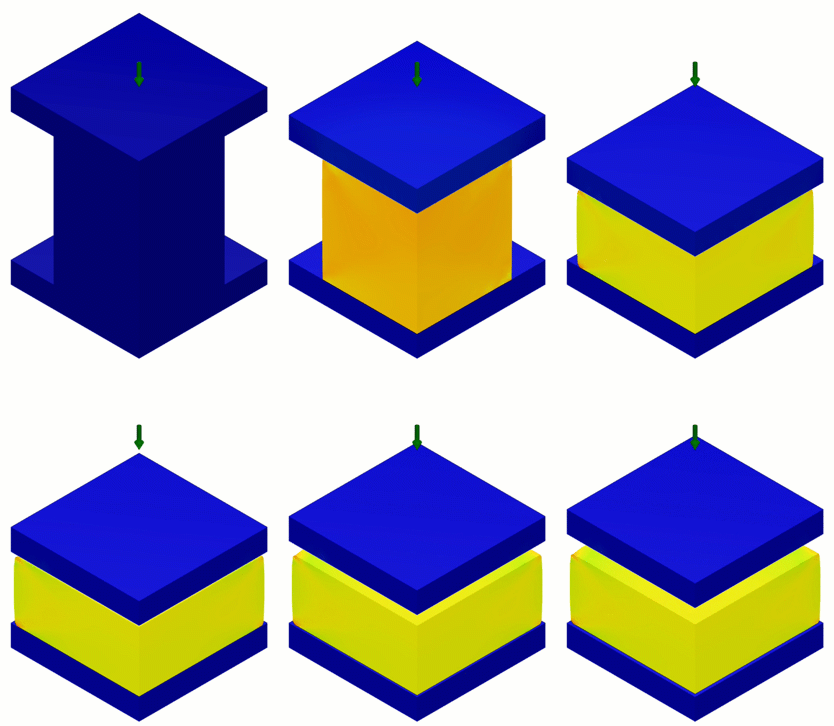
Animate the Strain and Displacement results to watch the shape and strain change throughout the event, making sure that the legend range is consistent throughout the animation.
We can view an animation of the results throughout the event. To prevent the legend range from changing for each frame of the animation, we can override the automatic legend range.
Switch back to the Strain result and click
 (Simulation workspace > Results tab > Result Tools panel > Legend Min/Max) to activate the Max and Min fields by the legend.
Type 1. in the Max. field. (Do not press Enter.)
Type 0.2 in the Min. field, and press Enter.
Click
 (Simulation workspace > Results tab > Result Tools panel > Animate) to open the Animate dialog.
In the Animate dialog, select One-way.
One-way replays the animation continuously, in the forward direction only, until you press
 Stop.
Stop.Choose Fastest from the Speed pull-down menu.
Type 40 in the Steps field.
There are 20 steps in the study output. Therefore, two animation frames will be produced per results step. The results are interpolated between the actual output steps.
Press
 Play to view the animation.
Switch to the Displacement result and repeat, using appropriate values for the legend max and min.
Click OK to stop the animation and close the dialog.
Activity 5 summary
In this activity, you
- Solved the study
- Displayed the Displacement and Strain results to view the tension and compression experience by the Billet as it is crushed
- Animated the Displacement and Strain results to simulate how the Billet changes throughout the event.