Activity 5: Review and compare the results for the various studies
In this activity, you
Review the Guided Result that is generated for the No heatsink model
Review the standard results that are generated for the No heatsink model
Compare the results generated for the One Heat Sink, Two Heat Sinks, and with Fan models
Identify which modfications are best for this model.
Prerequisites
Activity 4 is completed.
Steps
Enter the Results environment and review the Thresholds Guided Result for the No heatsink Simulation model.
On the Setup tab, click
 (Results panel > Simulation Results), to switch to the Results tab.
In the Browser, select No heatsink to switch to the No heatsink Simulation model.
Note: By default, the Thresholds Guided Result opens, which interprets the result for you and provides suggestions for how you might improve the results.On the Results toolbar, select
 (Inspect > Surface Probes) to open the Surface Probes dialog.
In the canvas, move your cursor over the various components to see the temperature that each component reaches. Click on a location to place the probe. Continue to set probes as you like, then click OK to close the dialog.
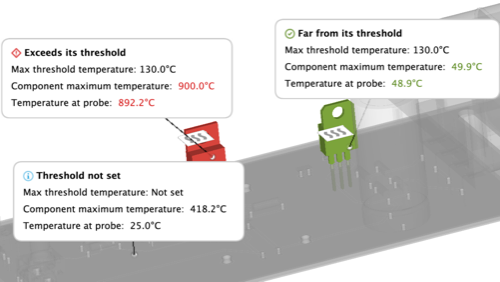
Notice: For components on which you have set a maximum temperature threshold, the label shows the temperatures in appropriate colors to help you see whether the temperature at the probe exceeds the threshold. If you haven't set a maximum temperature threshold, the information is still provided, but without color assistance.
Study the result using other Inspect commands, and review the suggested Next Steps. When you are ready, move to the next step.
Switch to the standard results for the No heatsink Simulation model and take a look at each result to see what information they provide.
On the Results toolbar, click
 (Display > Results), to switch to the standard results browser.
Notice that the Threshold Guided Result and the Maximum Thresholds result show the same data, but the Thresholds Guided Result provides you with assistance to interpret the result and identify what you can do next.
In the Browser, switch to the Component Temperature result.
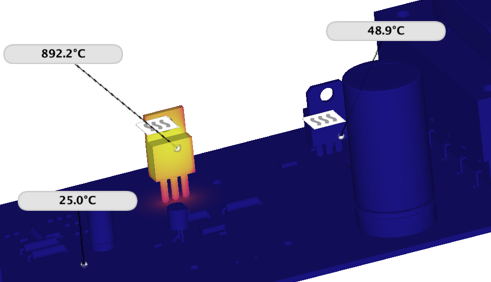
Notice that the probes you set previously remain as you switch between results. The Component Temperature result shows you the actual temperature that each component on the board reaches, without specifically noting whether they exceed set temperature thresholds. Click
 (Inspect > Hide All Probes) to hide the probes.
In the Browser, switch to the Air Velocity result.
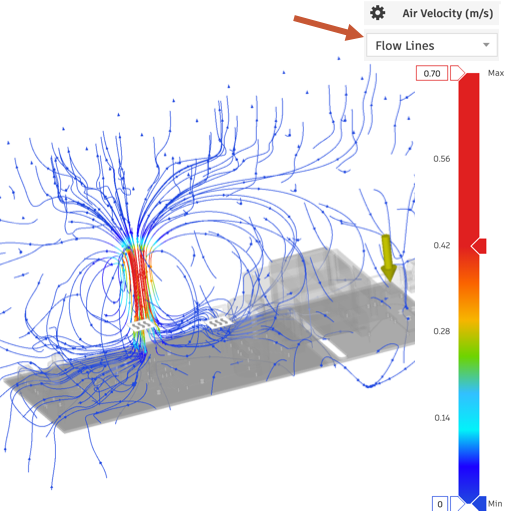
The flow lines visualization appears by default. Change the density of the flow lines in Result Settings above the Flow Lines visualization header. Use the dropdown menu to switch to Air Flow visualization.
In the Browser, continue to switch to other results until you have viewed them all.
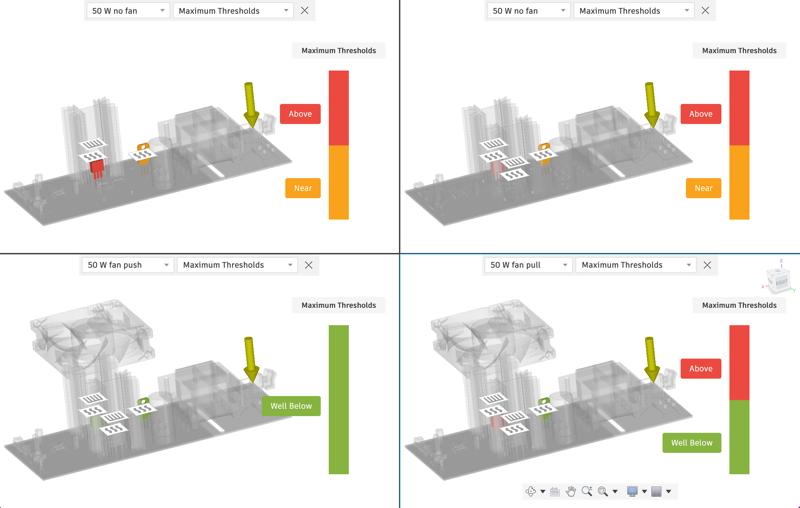
Compare the results generated by the other three Simulation models to see which study generates the best results.
In the Browser, switch to the One Heat Sink Simulation model.
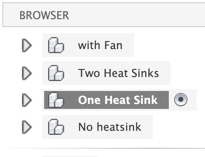
On the Results toolbar, click
 (Compare > Compare) to enter the Compare environment.Note: By default, two windows open, but you can select up to 4 separate windows.
On the Compare toolbar, click
 (Layouts > Four Vies) to open four windows.
In the top left window, leave the original result. In the top right window, select Two Heat Sinks, in the bottom left, select With Fan 50 W Fan Push, and in the bottom right, select With Fan 50 W Fan Pull and compare the results from the four studies.

As you might expect, adding a fan does reduce the component temperature more than just adding heat sinks, and pushing air into the enclosure has a greater cooling effect than pulling the warmer air out of the enclosure.
Switch to different results to see how the air flows with the different model variants and how the temperature of the various board components are affected.
When you have finished comparing results, on the Compare toolbar click
 (Finish Compare > Finish Compare) to return to the Results environment.
On the Results toolbar click
 (Finish Results > Finish Results) to return to the Setup environment.
Activity 5 summary
In this activity, you
- Reviewed the results that were generated for the No heatsink model
- Compared the results generated for the One Heat Sink, Two Heat Sinks, and with Fan models
- Identified which modfications are best for this model.