A Failure Grade turns an asset's deterioration results into a single, at-a-glance risk rating - so you can see where to act first without reading two separate numbers. Instead of interpreting Remaining Useful Life and Failure Probability on their own, you get one clear category, from Optimal to Critical, that's consistent across your whole network.
Each grade combines:
- Remaining Useful Life (RUL) — how much service life the asset is expected to have remaining
- Failure Probability — how likely the asset is to fail
By combining these values, Failure Grades provide a consistent way to compare assets and identify those that may require attention first.
Why Failure Grades matter
Age alone doesn't tell the full story. Two assets installed in the same year can have very different deterioration patterns. One may still have decades of expected service life remaining, while another may be approaching a high-risk period.
Failure Grades help you:
| Use case | Benefit |
|---|---|
| Prioritize replacement programs | Focus investment on assets with the greatest risk. |
| Identify high-risk assets | Quickly find assets that may require intervention. |
| Compare asset groups | Understand how risk is distributed across the network. |
| Communicate risk | Use consistent categories when discussing priorities with stakeholders. |
How Failure Grades are determined
Failure Grades are calculated from the results of a deterioration model.
The diagram below shows how asset data flows through the deterioration modeling process to produce a Failure Grade.
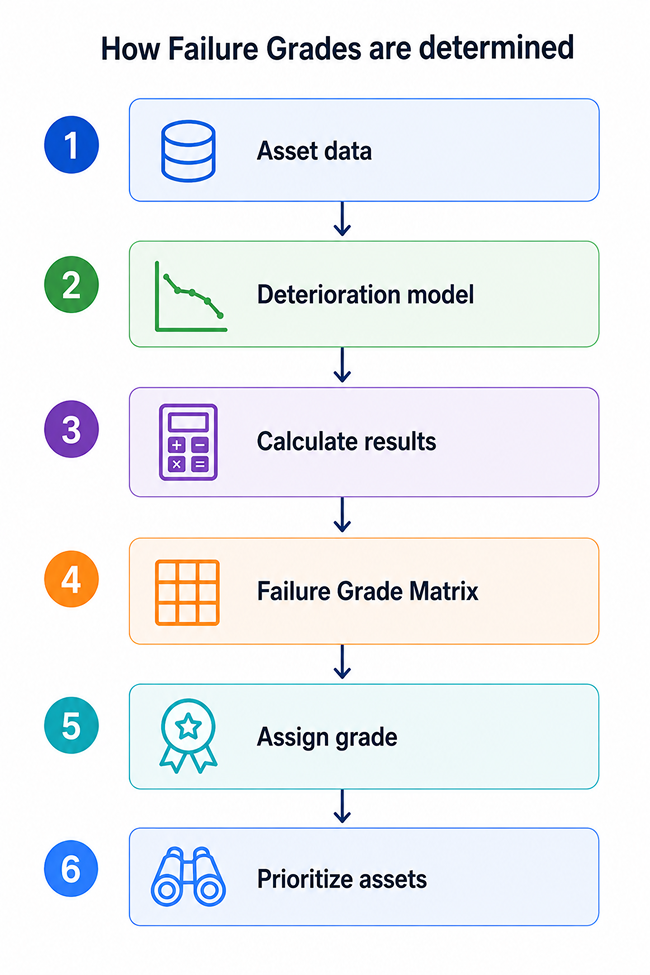
Step 1: Asset data
The model starts with asset information such as:
- Age
- Material
- Installation year
- Asset history
- Other asset attributes
These attributes determine which asset group an asset belongs to - and therefore which survival curve applies to it.
Step 2: Deterioration model
The model places each asset - by its age - on the survival curve assigned to its asset group, to see how far along the expected deterioration path it is.
Step 3: Calculate deterioration results
For each asset, the model calculates:
- Remaining Useful Life (RUL)
- Failure Probability
Step 4: Apply the Failure Grade Matrix
The Failure Grade Matrix combines Remaining Useful Life and Failure Probability using the configured grade thresholds.
Step 5: Assign a grade
Each asset is assigned a Failure Grade:
- Optimal
- Stable
- Moderate
- Concerning
- Critical
Step 6: Prioritize assets
Use Failure Grades to:
- Identify high-risk assets
- Prioritize maintenance activities
- Support renewal planning
- Communicate risk consistently across the organization
Understanding the Failure Grade Matrix
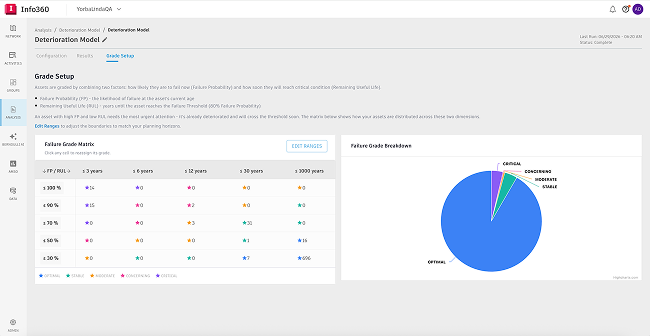
The Failure Grade Matrix is a 5 × 5 grid that maps deterioration results to risk categories.
- Rows represent Failure Probability ranges (highest at the top).
- Columns represent Remaining Useful Life ranges (lowest on the left).
- Each cell represents a Failure Grade.
As assets move toward lower Remaining Useful Life and higher Failure Probability, their grade severity increases.
How to read the matrix
| Remaining Useful Life | Failure Probability | Typical result |
|---|---|---|
| High | Low | Lower grade (Optimal or Stable) |
| High | High | Moderate grade because failure risk is elevated |
| Low | Low | Moderate grade because the asset is approaching end of life |
| Low | High | Higher grade (Concerning or Critical) |
Think of the matrix as a balance between:
- How much life an asset has left
- How likely it is to fail.
The highest-risk assets fall in the top-left of the matrix, where Failure Probability is highest and Remaining Useful Life is lowest. The lowest-risk assets sit in the bottom-right, where Remaining Useful Life is high and Failure Probability is low.
Grade categories
By default, the matrix uses five grade categories.
| Grade | Risk level | Typical characteristics | Suggested action* |
|---|---|---|---|
| Optimal | Lowest | Long remaining service life and low failure probability | Continue routine monitoring |
| Stable | Low | Performing as expected with limited risk indicators | Monitor through normal asset management processes |
| Moderate | Medium | Deterioration is becoming noticeable or risk is increasing | Review condition and begin planning future intervention |
| Concerning | High | Limited remaining service life and elevated failure probability | Prioritize for detailed assessment or renewal planning |
| Critical | Highest | Near or beyond expected service life with a high probability of failure | Consider immediate intervention, replacement, or risk mitigation |
Configuring Failure Grades
The Grade Setup tab allows you to customize how grades are assigned.
You can:
- Adjust Remaining Useful Life ranges.
- Adjust Failure Probability ranges.
- Change the grade assigned to any matrix cell (click a cell to reassign its grade).
As you make changes, the grade distribution updates automatically so you can see how assets are categorized across the network.
Organizations often adjust thresholds to align with:
- risk tolerance,
- regulatory requirements,
- investment strategies,
- asset management policies.
Example
The following example shows how deterioration results can lead to different grades.
| Asset | Remaining Useful Life | Failure Probability | Likely Grade | Why |
|---|---|---|---|---|
| Pipe A | 40 years | 10% | Optimal / Stable | Long expected service life and low likelihood of failure |
| Pipe B | 15 years | 45% | Moderate | Risk is increasing and future intervention may be required |
| Pipe C | 5 years | 75% | Concerning / Critical | Limited service life remaining and high likelihood of failure |
Although all three assets belong to the same network, their grades help identify which assets should be reviewed first.