Predict when your assets may fail and how much useful life remains - so you can prioritize renewals, plan budgets, and reduce risk.
Deterioration Modeling lets you estimate the condition of your whole network without digging: using survival curves and each asset's age, it predicts how your assets are likely to perform over time.
For every asset, the model gives you:
- Failure Probability (%) - how likely the asset is to fail now.
- Remaining Useful Life (RUL) - years until it reaches the 80% failure-probability threshold.
- Expected Failure Year - the year it's projected to reach end of life.
- Failure Grade - a single risk category (Optimal → Critical) for quick prioritization.
Use these to answer: Which assets are most at risk? Which groups are deteriorating fastest? When are failures likely? Where should renewal and capital investment go first?
Currently Info360 Asset supports water and wastewater pipes.
How Deterioration Modeling works
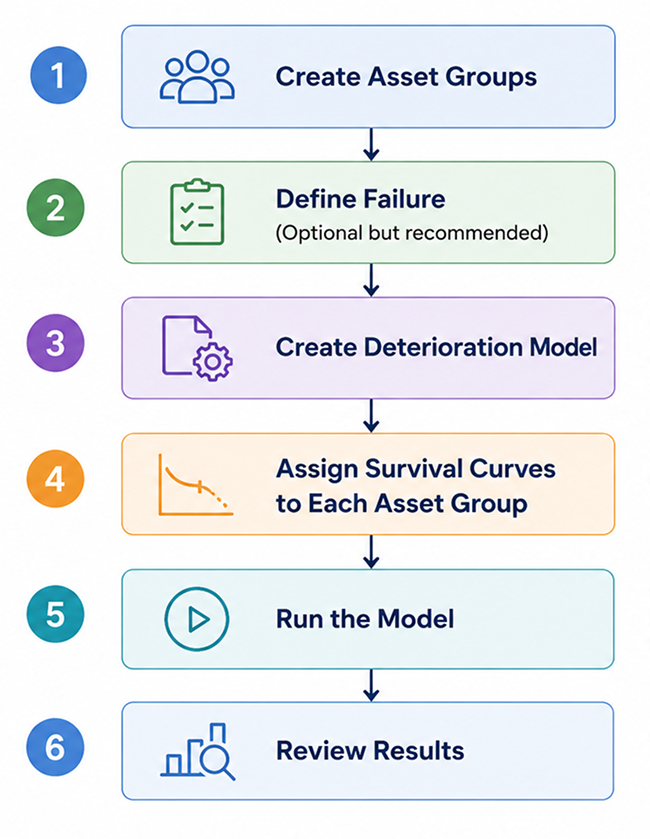
Create Asset Groups
Why groups?
Different assets age differently - PVC < 16" behaves nothing like cast iron laid in the 1970s. Grouping similar assets (by material, diameter, installation era) lets you assign the right survival curve to each group and get more accurate predictions.
Example groups
- Steel < 16 in
- Steel 16–36 in
- Steel > 36 in
- Cast iron (1950–1980)
Define failure (optional, but recommended)
Why? If you tell the model what counts as "failure" - from your inspection, task, or event history - it fits survival curves to your real data, which makes predictions more reliable.
Create the model
Choose your system type, asset type, and asset group set, give the model a name, and optionally attach a failure definition (you can also add it later).
Assign survival curves to each group
Each group needs a curve describing how its assets deteriorate. Choose how each curve is built:
- From your own failure data (via a Failure Definition) - when the group has enough recorded failures (at least 5) for the model to fit a curve to your network's real performance.
- An industry-standard curve - a proven benchmark built from failure data across 500+ U.S. utilities. A strong, defensible choice in its own right, and the natural pick when a group doesn't have enough local failures to fit its own curve.
- Define it yourself - a custom curve, a single expected service life, or a copy of another group's curve.
Groups left without a curve won't produce results.
About Survival CurvesRun the model
Results are calculated in the background - you can leave the page and come back. When it finishes, models with results open on the Results tab.
Review results
Inspect individual assets, compare groups, and open any asset with See curve to see it plotted on its group's curve with a plain-language explanation of its scores. Use the Failure Grades to prioritize - start with Critical and Concerning.
Learn more: