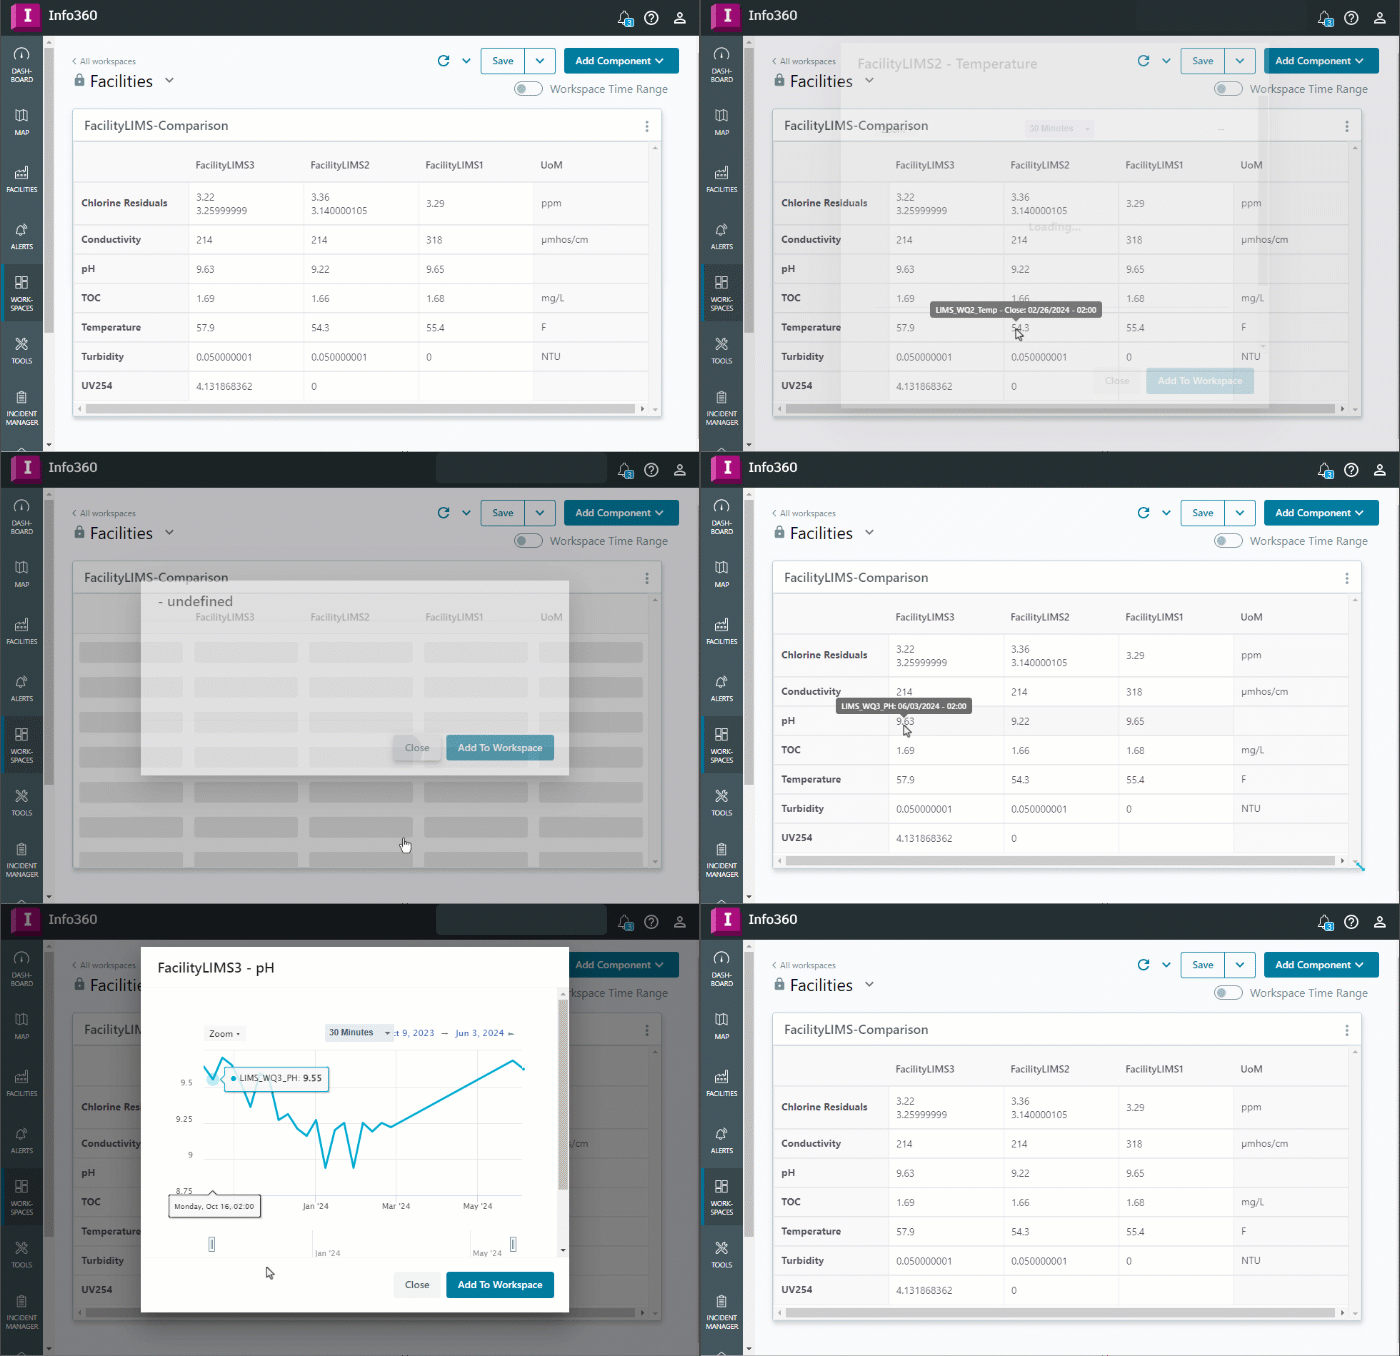
Add a Comparison Table to compare data points for different groups of sensors. For example, to compare the latest sensor readings for different facilities of the same type.
The table displays the latest available data in the workspace time range.

You can click on any of the data points in the table to open a historical chart for that sensor. You can also add this chart to a workspace.
Before adding a comparison table, make sure you have the necessary sensor groups set up. See Create a Sensor Group.
To add a Comparison Table:
- In your workspace, choose Add Component
 Comparison Table.
- Choose one or more Sensor Groups. See how to create sensor groups. If you want to include different sensor types in a group, use the Multi-Type option.
- If there any sensor types that you don't want to include in the table, uncheck the box beside them.
- Enter a name and description for your table.
- Select the resolution for the table.
- Time Range: If you want to show data for a specific time period in your table, turn this on and then select the specific dates or how many days to go back (time offset).
- Click Submit.
By default, Close values are shown in the table. If you want to change this:
- Once you've added your table, click on the three dot menu
 and select Configure.
- Expand the sensor type you want to modify.
- Change the Function type as needed.
- Then click Update.