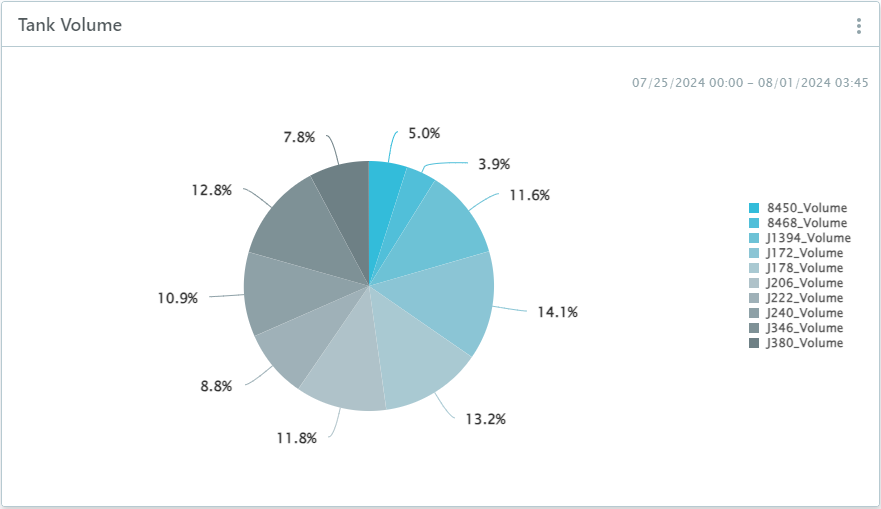
Add a pie chart to see how a total amount is divided between a group of sensors.
For example, to see the percentage for each tank with regards to total volume.
To add a pie chart:
- In your workspace, choose Add Component
 Pie Chart.
- Choose a Sensor Group. See how to create sensor groups.
- Enter a name and description for your chart.
- Select the series type for the data.
- Select the specific dates (time range) for the data or how many days to go back (time offset).
- Click Submit.
Once you've added the chart, you can open
 Configure Display Options, to configure the chart display.