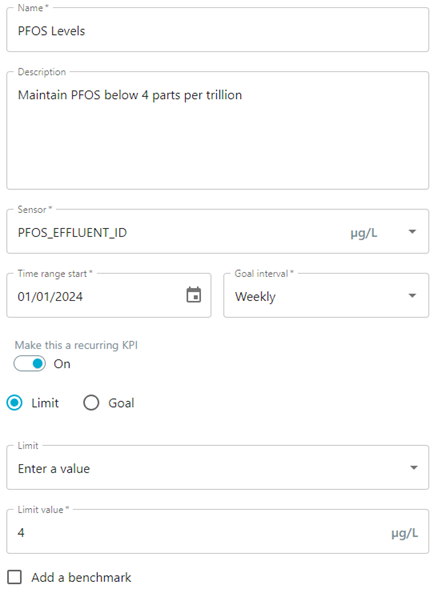
Use the Key Performance Indicator (KPI) tool to track performance in relation to a goal or limit.
You can create KPIs for sensors you have in Info360 Insight (both physical and virtual).
You can measure performance against either a fixed value or another sensor (again, this can be analytic results).
To create a KPI
- Go to Tools
 Key Performance Indicators and select Add New KPI.
- Enter a name and description for the KPI.
- Select the sensor for which you want to measure performance.
This can be a physical sensor (with live data) or a virtual sensor (from a form or an analytic).
- Define the Time Range Start Date for the KPI, and choose the Interval (Daily, Weekly, Monthly or Yearly).
- If you decide to 'Make this a Recurring KPI', each time the time range ends, the KPI will be set again for the same interval.
For example, if you set the start date to a Monday and set a weekly interval, the KPI will recur each Monday. You'll also be able to see the results history for each week.
- Choose between setting a Limit (a value you want to stay at or below) or a Goal (a value you want to reach or go above).
- Choose whether you want to measure performance against a fixed value or against another sensor. Then, either enter the fixed value or select the sensor.
- Optionally, you can also add a Benchmark to measure performance against another reference value or sensor.
- Once you have finished configuring the KPI, click Next.
You'll be able to see the calculated results and can choose to add them to a Workspace. The values displayed and compared in the chart are the close values.
