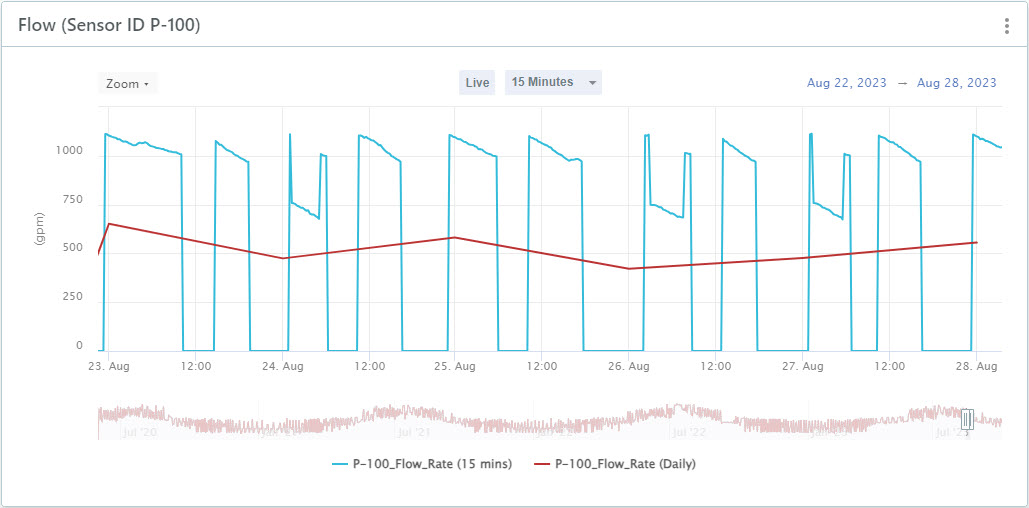
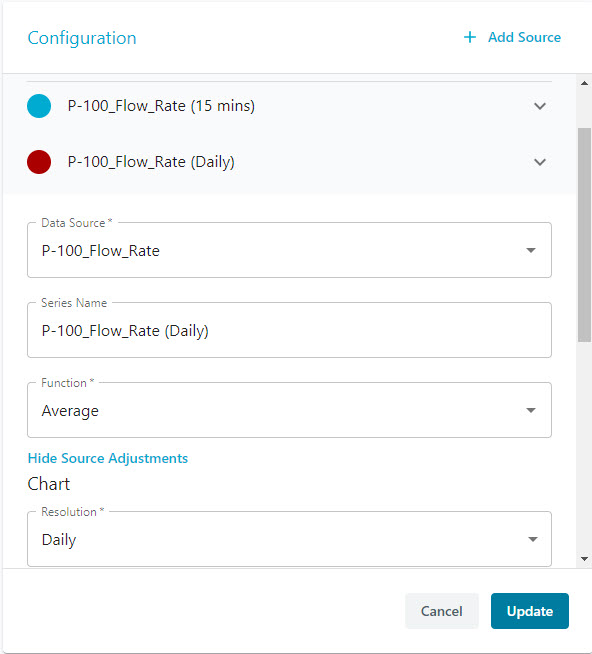
To spot anomalies and validate your data, you can add multiple data series for the same sensor with different intervals.
For example, you may want to see raw sensor data relative to hourly or daily data.

Note: When comparing very granular raw data with lower resolution data, it is preferable to use the Open series type (Function). This is because
Info360 Insight anchors data points on the chart to the 00 minute of the hour, not the 59 minute of the hour. For example, the close value for the hour 09:00 to 09:59 is shown on the chart at the 09:00 marker, meaning you would observe what seems like a data shift between the raw series and the close series.
To add multiple data series for the same sensor:
- Create your historical chart with the sensor as the data source. See Create a Historical Chart.
- Once created, click on the three dots icon

 Configure.
- Select + Add Source and choose the same sensor as the data source. Then click Add Source.
- Click on the source you just added to expand the details. Then click on Show Source Adjustments.
- Change the Resolution to a different interval.
Tip: You may also want to edit the Series Name to include the resolution so it is easier to differentiate the series in your chart.

- You can repeat to add more series with different intervals.
- Click Update to save the changes.