This method is based on ADAS 345 and originally intended for land drainage design. See ADAS reference book 345 (The design of field drainage pipe systems), ADAS.
The Peak Flood Flow Q0 for catchments under 30 ha
The ADAS 345 document does not refer to any return period but yields a “Peak Flood Flow”. However, the ADAS 345 method is a simplified form of a more comprehensive ADAS method within report number 5, which is no longer in print. In Report Number 5 return periods were listed rather than the crop types shown in ADAS 345. Crop types were intended to imply a selected risk category and therefore give a different return period depending on the value of the crop. ADAS has confirmed that selecting “Grass” from the chart you are actually selecting the return period of 2 years. Therefore, growth curves can be applied to the two-year return period event. This in confirmed in the Environment Agency Flood Estimation Guidelines.
A two-year peak runoff may be converted to a Mean Annual Flood using Table 1 of FSR No 2, 1977. The Mean Annual Flood may then be converted to other return periods using the method described for IH 124.
Q0 = ST.F.A
where
ST: Soil type factor
A: Area in hectares
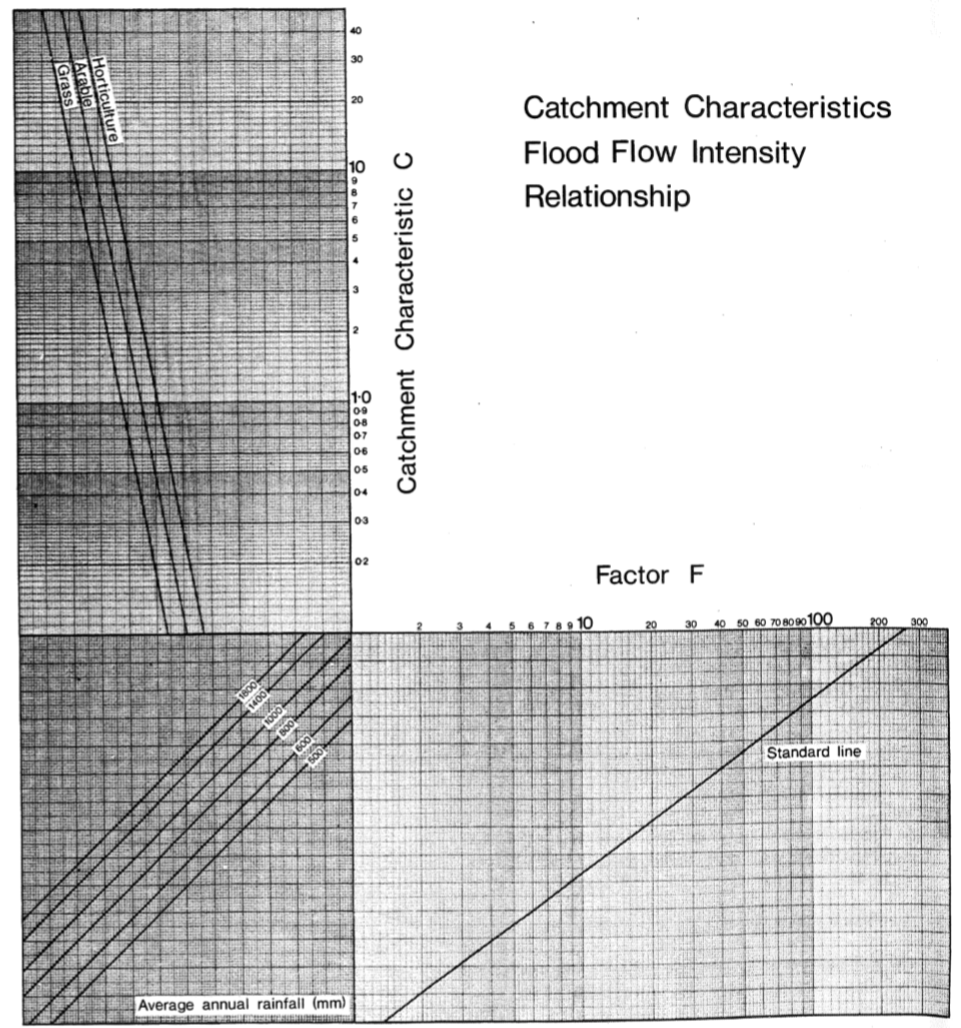
F: Number derived from a lookup process outlined below:
Catchment Characteristic C

This is then used along with the selected crop type and average annual rainfall to determine the image from the graph below:

The image above has been copied from 'The design of field drainage pipe systems' ADAS Reference Book 345.

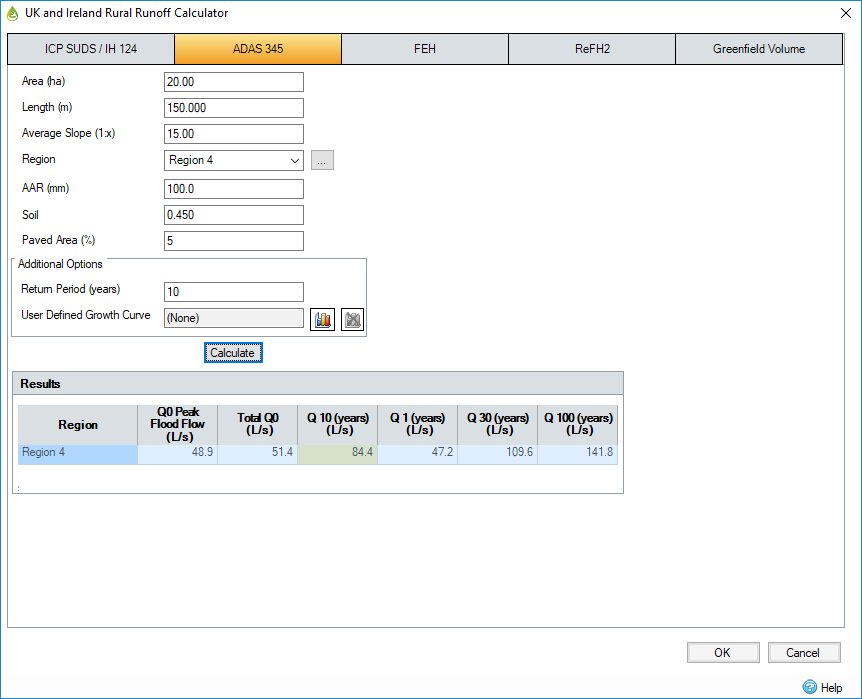
Input Variables
Area - Catchment area.
Length - The maximum length of the catchment.
Average Slope - Average slope of catchment (height/length).
Region - Region number of the catchment based on FSR Figure I.2.4. This can be selected from the Region Picker.
AAR - The average rainfall.
Soil Type - Determine the soil type factor ST.
|
Permeability class |
St |
|
Very slow |
1 |
|
Slow to Moderate |
0.8 |
|
Moderate |
0.5 |
|
Very Rapid |
0.1 |
*There are more details available from the above reference.
Paved Area - Percentage paved but not exceeding 10%.
Additional Options
Return Period - Rainfall return period between 1 and 1000 years.
Growth Curve - Click the Growth Curve Details icon to open the Growth Curve Editor.
Output Variables
Q0 - Peak flood flow for 2 year return period.
Total Q - Peak flood flow including Paved area for 2 year return period.