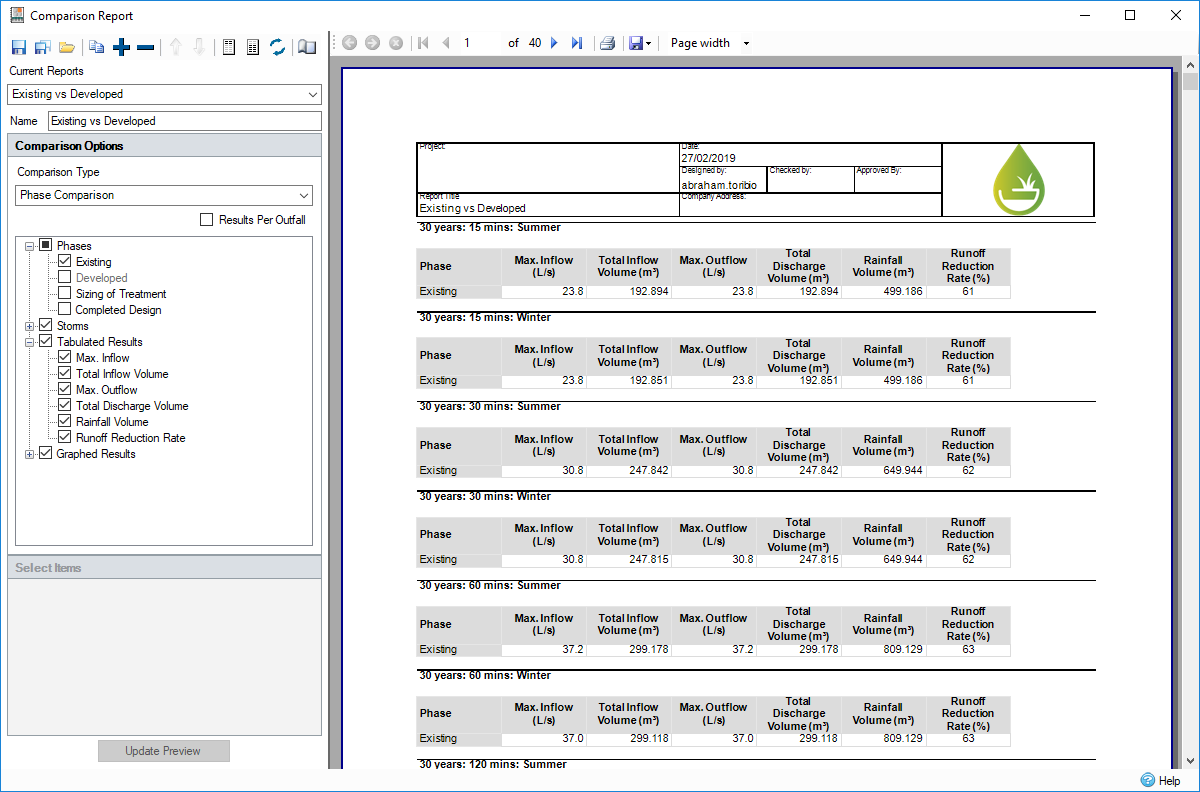
The Comparison Report allows you to directly compare results from individual connections, inflows, junctions or drainage systems across different phases. The total phase results can also be compared.
Comparison Reports can be created for any like to like comparison, e.g. a drainage system with another drainage system or a junction. Multiple reports can be created to be rendered at once. Time series analysis of the results can be done using graphs, along side detailed tabulated information with peak and total values.
All reports can be exported to a variety of formats, including printed to page and PDF.

Validation
For a report to be valid, the following conditions must be met:
- At least one Phase must be selected.
- At least one Storm must be selected (the critical storm is valid unless only showing graphs).
- At least one result must be selected - either a table or a graph result.
- If not doing a phase to phase comparison, at least one item per selected phase must be chosen.
Any reports that do not meet these criteria will not be drawn, and an error will be shown. If multiple reports exist, all valid ones will be drawn, but a warning will be shown explaining that some reports were invalid.
Comparison Report Toolbar
The toolbar in the selection control allows:

Save current report/ Save all reports - These buttons allow you to save the current or all reports, either as individuals or as the entire working set.
Load Reports - This button allows reports to be loaded to file, either as individuals or as the entire working set.
Duplicate current report - This button allows you to create a duplicate report.
Add Report - This button allows you to add a report.
Delete current report - This button allows you to remove the current report. Attempting to remove the final Report will clear the active report and revert to a blank template.
Move current report up/down - These buttons allow you to move reports up or down in the ordering. This will re-order the reports when they are drawn on the preview.
Header Font - This button allows you to modify the fonts of the header.
Select Report Font - This button allows you to modify the fonts of the report.
Reset Font - This button allows you to reset the fonts used.
Edit Page Settings - Opens dialog box to allow page settings to be changed. This is linked to the local page setting in file print.
Report Management

Reports hold a single comparison as defined by the user. Multiple reports can be created, and on updating the preview are displayed in the desired order. Reports are saved locally within the site, and will be recovered as best as possible when re-opening the form after making changes and re-analyzing the site. Any phases, storms, or nodes that no longer exist will be removed from the report when it is loaded.
The drop-down menu can be used to select a different report, which will populate the Comparison Options as seen below. The name textbox allows you to enter a unique name to identify the report; this will be shown at the top of each page of the report.
Comparison Selection
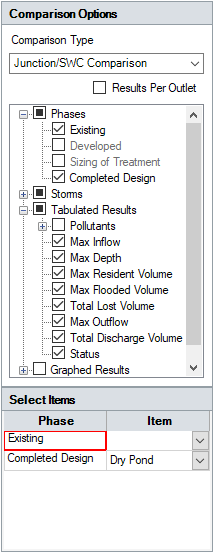
Selection of items is done in the Comparison Selection box. From here the Comparison Type must be selected, which will filter the rest of the options available, irrelevant graph or result selections are removed from the displayed options.

The checkbox for Results Per Outlet will increase the information for a Junction or Drainage System to include component outflows per outlet. The same option, when in a Phase to Phase comparison, is instead labelled Results Per Outfall, which separates all the outflows leaving the system by their Junction or SWC.
Phases and storms can be selected for all comparison types. The storms node also contains the Critical Storm node. Note that you cannot graph the Critical Storm, and a report with only the critical storm and graphs selected is therefore invalid. The storm selected for the 1D/2D analysis is not available for selection.
Tabulated and Graphed results will vary depending on the selected Comparison Types. Any pollutants that are present in the site will be available for selection when doing a Junction/SWC comparison. Pollutants can be selected separately for Graphing and Tabulation.
If not doing a Phase to Phase comparison, the individual items per phase must be selected. Only one item can be selected per phase. Multiple phases are not required for a report generation.
Navigation
The toolbar at the top of the viewer can be used to navigate through reports, adjust the zoom level, and more.
![]()
The Save icon allows exporting of the currently drawn set of reports to a variety of formats:
- CSV
- Excel
- RTF
- TIFF
- Web Archive
- XPS document
The Page Settings, Print Preview and Print buttons are all as standard, and allow selection of the page size, orientation, and margins.