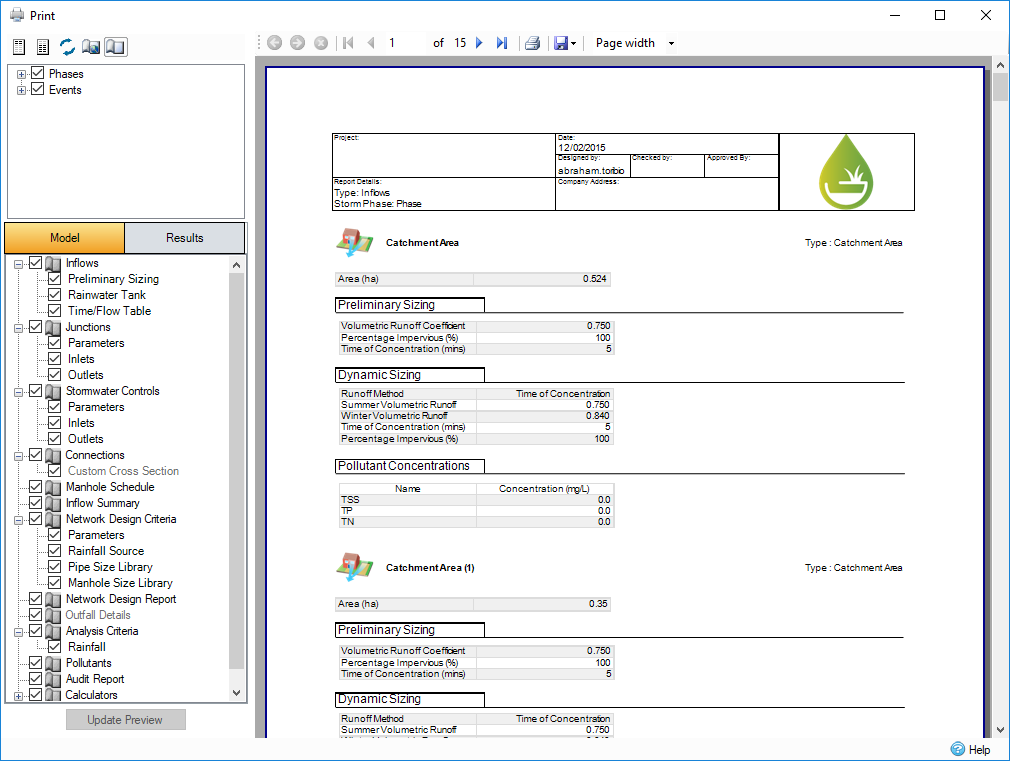
The Print option in the File Menu displays a preview of the document, as well as the various options available when outputting to a printer or file.

Print Toolbar
The toolbar in the selection control offers users a way to modify fonts used on the reports. it also allows the user to toggle the usage of local page settings.

Select Header Font - This button allows you to modify the fonts of the header.
Select Report Font - This button allows you to modify the fonts of the report.
Reset Fonts - This button allows you to reset the fonts used.
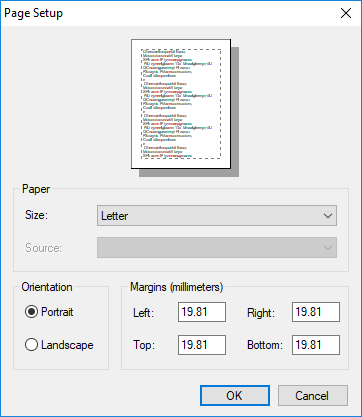
Global Page Settings - Opens the Page Setup dialog box to allow the global page settings to be changed. For more information, refer to Page Settings below.
Local Page Settings On/Off - This button allows you to turn on/off the local page settings in Comparison Report, Manhole Schedule, Audit Report, etc.. For more information, refer to Page Settings below.
Page Settings
Global Page Settings
The global page settings allow you to select the paper size and source, as well as set the orientation and margins for all pages. Global page settings apply to the entire print output. Local page settings will override the global settings, in which case the report that has local page settings will be applied to the page.

Local Page Settings
Global page settings can be overridden on a page-by-page basis as long as the override local page settings button is enabled. Local settings can be defined by clicking on the page settings icons on the selection control tree view (to the right of the check boxes) or right-clicking the chosen report and selecting the edit page settings option. This will then open a dialog box the same as global page settings apart from paper size and source cannot be specified, in this dialog page orientation and margins may be specified for that report. The local page settings can be cleared by right-clicking on the node and selecting the clear page settings option.
Phase Selection
Use the phases branch to select which Phases and/or individual Flow Paths to report on. The phases are grouped by Storm and Sanitary phases.
Storm Selection
Choose Current Storm (set by the Storm Selector in the main window), All Storms or Selected Storms from the drop-down menu. When Selected Storms is shown the Select button is activated and the user can choose which storms are included using a simple checkbox dialogue. The critical storm for the Phase Summary looks for the storm with most outflow from the outfalls. With no outfalls the first storm is used.
Event Selection
Replacing the Storm selection is a new Event selection. This branch allows for both Storms (now named Rainfall) and Dry Weather Flows to be selected. Rainfall works as it did before in that you can select a critical storm or select individual storms to generate results reports for, rainfall will only be available if a Rainfall Phase exists on the site. Dry Weather Flows must be selected in order to generate reports for Dry Weather phases and will only be available if a Dry Weather Phase exists on the site. You can now use the 2D Event to generate reports for 1D-2D results, only available if we have a phase on the site that has 2D results.
Critical By Return Period - The Critical by Return Period option will display results for the critical storm from each return period / increase rainfall grouping selected.
The return period / increase rainfall groupings are as follows for the given rainfall sets:
FEH / FSR / Chinese Design / NOAA - grouped by Return Period and Increase Rainfall from the current storm. e.g if the current storm is FEH: 5 years: +30%: 120mins Winter - then the critical storm will be identified from all the results for FEH 5year + 30% storm duration range.
ARR - grouped by AEP and Increase Rainfall from the current storm. e.g if the current storm is ARR: 50 %: +30%: 120mins - then the critical storm will be identified from all the results for ARR 5% + 30% storm duration range.
Desbordes / Known / User Defined - grouped by Increase Rainfall from the current storm. e.g if the current storm is Desbordes: 5 years: +10%: 15mins - then the critical storm will be identified from all the results for Desbordes +10% storm duration range.
SCS - no grouping. All SCS results are considered.
Selected Storms - for ARR, selected storms will display the temporal pattern result for the selected AEP / Increase Rainfall / Storm duration based on the mean of the critical rank by property over the 10 temporal patterns.
Report Selection
The Model and Results tabs allows users to select the design components and results to include in the report. Items become available as they are added or generated during the course of the design and analysis.


Model Items
The model or domain items that can be printed are the phase features Inflows, Junctions , Stormwater Controls - SWC, Connections, Inlets and Outlets. Other reports that are available to view individually can also be included in the PRINTED report, these are Manhole Schedule, Inflow Summary, Network Design Criteria, Network Design Report, Outfall Details, Analysis Criteria, Pollutants, Audit Report and Calculators.
Audit Report
An Audit Report must be generated first to be available in the print form.
Results Items
The results tab is only available when selected phases have been analyzed. The results items that can be printed are the results features Phase Management, Inflows Summary, Junctions Summary, Stormwater Controls Summary, Connections Summary, Inflow - Item Results, Junctions - Item Results, Stormwater Controls - Item Results, Connection - Item Results, and Comparison Report.
Each results item and phase management have additional options to specify graphs, tables and pollution. Some of these options will have additional children to allow certain columns/data to be shown or not.
The summaries allow you to specify between all items per storm or all storms per item. Each results item can also be filtered to show the critical storm, all storms or individual storms. Phase Management when printed uses the critical storm by looking for the storm with most outflow from all the outfalls. When there are no outfalls the first storm is used.
Comparison Reports
If any Comparison Report have been generated previously, they will be listed in the Comparison Reports branch on the Results selection tree and can be included in the printed report.
Navigation
The navigation toolbar at the top of the dialog can be used to navigate through each page by using the arrows or by entering a page number.

The Print icon allows you to select the printer type, page range, paper orientation, number of copies, and other standard print functions.
The Save icon allows you to export the currently drawn set of reports to a variety of formats:
- CSV
- Excel
- RTF
- TIFF
- Web Archive