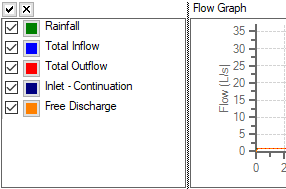
Item Results forms and the Phase Management form provide graphs with the following extra features.
Colours
The colours of individual series can be changed using the coloured buttons on the left hand side of the legend. These colours will be saved as soon as they are specified, and are consistent across all files.

Show / Hide Graphs
Using the buttons in the toolbar of any result forms graph tab will toggle the visibility of specific graphs. This allows remaining graphs to grow, showing the Y axis in more detail.

Show / Hide Series
Individual series can be shown or hidden using the tick boxes on the left hand side of the legend. The buttons above the legend can be used to show or hide all of the series at once.

Splitter movement
In the results forms, the graphs are separated from their legends by a splitter. This splitter can be moved to show more detail along the x-axis of the graph, or to display longer series names in the legend.
