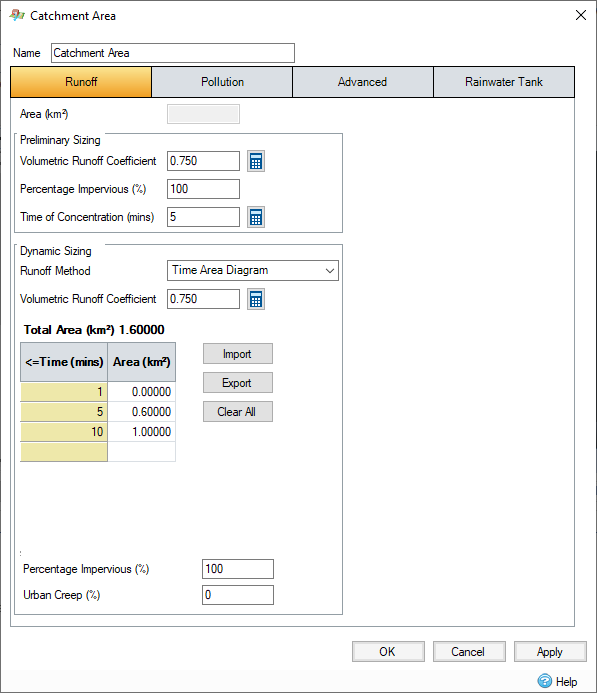
Subcatchments may be entered in the form of a Time/Area spreadsheet. The hydrograph is calculated by combining the rainfall profile with the time area input. The Time / Area diagram accounts for the effect the time of flow into the stormwater control has on the inflow hydrograph.

Spreadsheet - Enter the area that enters the storage structure for each timestep.
- Time - The time area diagram may be specified at a user defined set of time steps.
- Area - The area that enters for the given time period, that is from the time entered to the time below.
- Import and Export - These allow the current Time Area Diagram details to be imported from and export to file so that the details can be reused
- Clear All - The clear button clears the contents of the table.
Percent Impervious - Pervious portion of the Inflows area. When the Use Land Uses/Soil Types layers box is checked, the Percentage Impervious is calculated from weighted averages of Land Uses.
Urban Creep - This scales the impermeable area by the amount specified. This can be used to take the increase of urban areas, or other factors into account. This value is only enabled (and used) when the analysis creep of the Analysis Criteria is set to "Use Catchment Areas ".
Analysis
The rainfall profile and the time area diagram are combined with the volumetric runoff coefficient in the following way:
Q1 = (I1 x A1) x 2.78 x Cv
Q2 = (I1 x A2 + I2 x A1) x 2.78 x Cv
Q3 = (I1 x A3 + I2 x A2 + I3 x A1) x 2.78 x Cv
and so on.