This tutorial introduces InfoWater Pro's energy management and costing capability. Using InfoWater’s energy management functions you can determine all pertinent pumping cost information based on system operation (network hydraulics), pump efficiency (constant or varying), energy rates ($/kWh) charged by the electric utility, and optionally demand charges ($/max. kW) assessed by the electric utility.
InfoWater Pro will calculate operating costs for any pump in your model for which you have assigned efficiency and energy charging rate information. Each pump can be assigned different efficiency data, energy rates, and demand charge information.
In this tutorial, you will assign variable efficiency data to each of the two pumps in the Tutorial model. Both pumps will also be assigned a common energy charging rate.
Variable pump efficiency data is represented by Curves in InfoWater Pro. Energy rate and demand charge patterns are represented by time-varying Patterns.
Step 1: Create Pump Efficiency Curves
Each pump will be assigned a different efficiency curve. The curve represents the relationship between pump efficiency (as a percentage) and flow rate through the pump.
Create a Curve
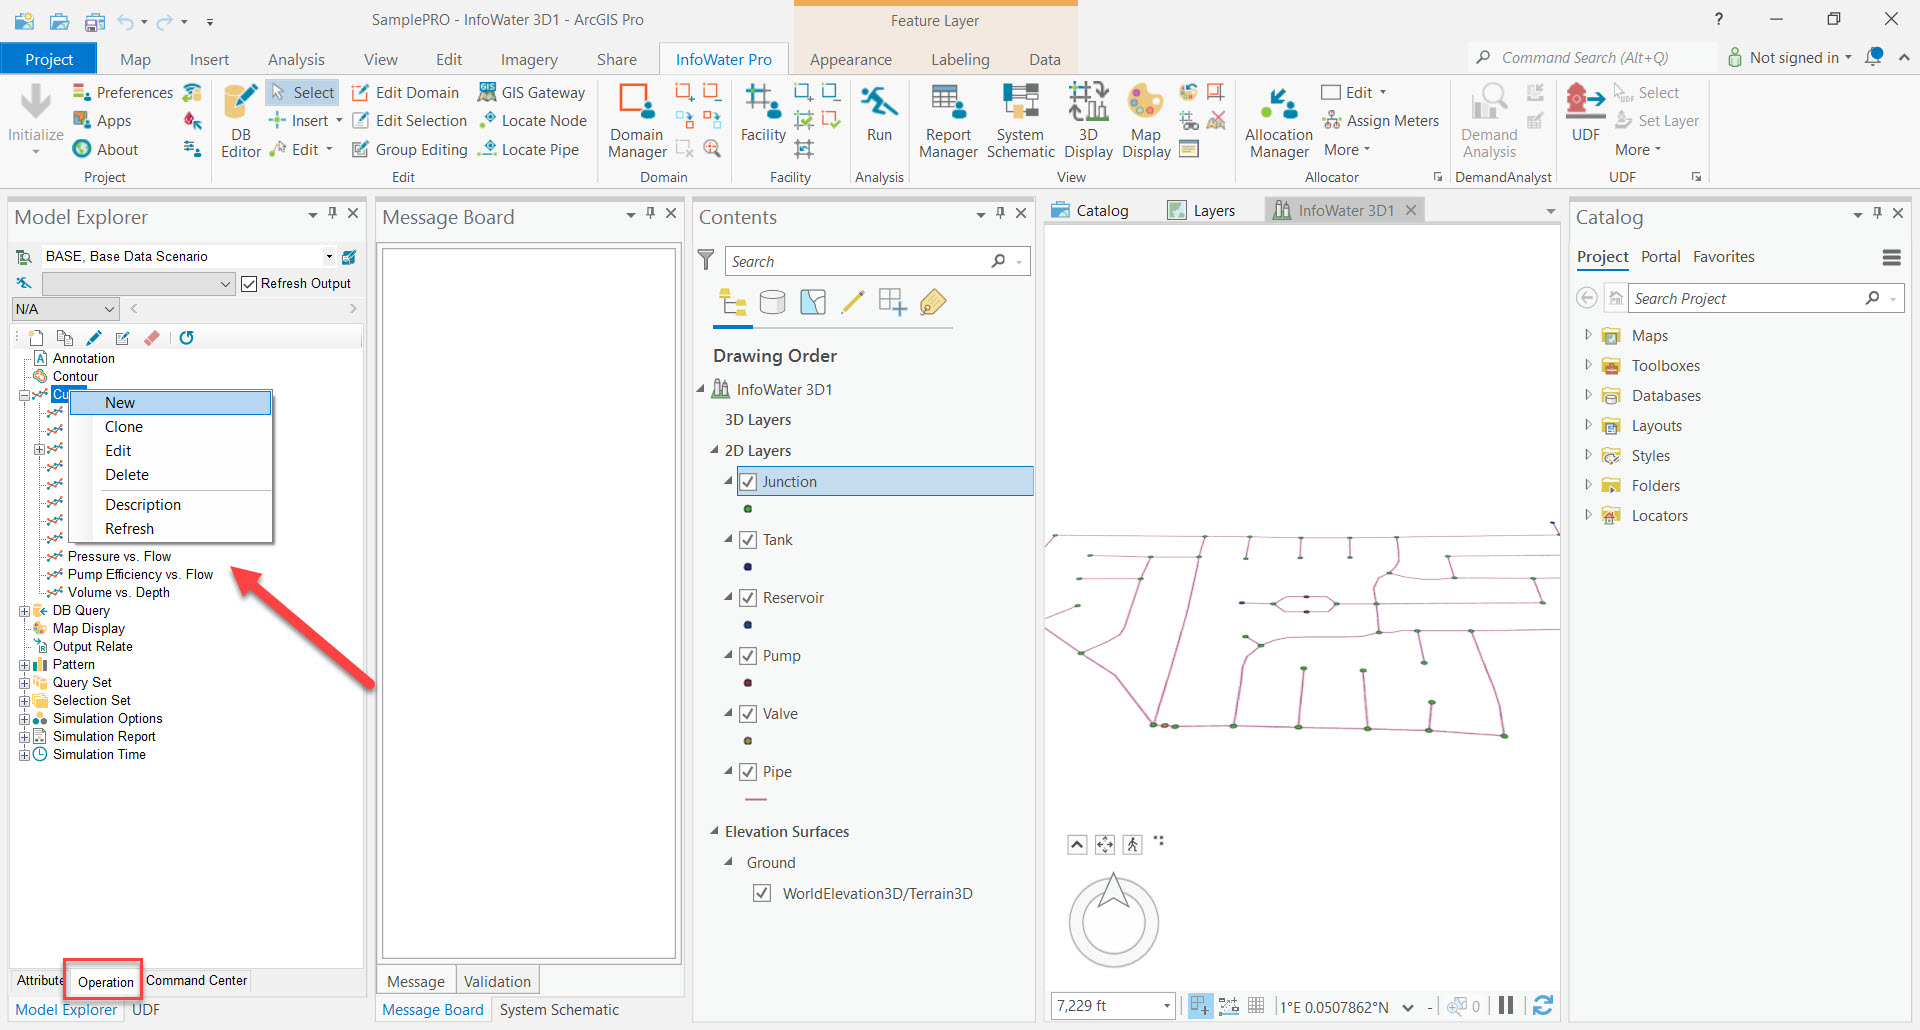
- Select the Operation tab from the Model Explorer, click once on Curve, and then right-click and select the New command, as shown below.
-
-
You are prompted to enter a new ID and description for the curve. Enter “1, Efficiency – Pump 200” and choose the OK button. You will enter three data points to represent pump 200 efficiency curve:
Row Number Flow (X) Efficiency (Y) 1 0.00 50.00 2 400.00 80.00 3 600.00 75.00 -
The Curve dialog box appears on the screen. Enter the three data points for the efficiency curve for pump 200:
Choose the Set Rows
 button and enter a value of “3” and choose OK.Go to each row and enter the data points from the table above. Press the Tab key on your computer keyboard to apply the change.
Click on the Save
 button at the top of the Curve dialog box. Curve 1 now contains three data points and is ready for use.
 -
Repeat steps 2 and 3 to create the curve representing efficiencies for pump 210. For this curve, click on the New button and then enter an ID and description of “2, Efficiency – Pump 210” and click on the OK button. You will enter three data points to represent pump 210 efficiency:
Row Number Flow (X) Efficiency (Y) 1 0.00 50.00 2 300.00 80.00 3 500.00 75.00 -
Click on the OK
 button to close the Curve dialog box.
Step 2: Create Energy Charge Pattern
Both pumps will share the same energy charge pattern. It is assumed for this tutorial the same electric rates are applied to each pump. However, in your projects, you can use any number of different energy rates. In this tutorial, you will not assign demand charge patterns.
Create a Pattern
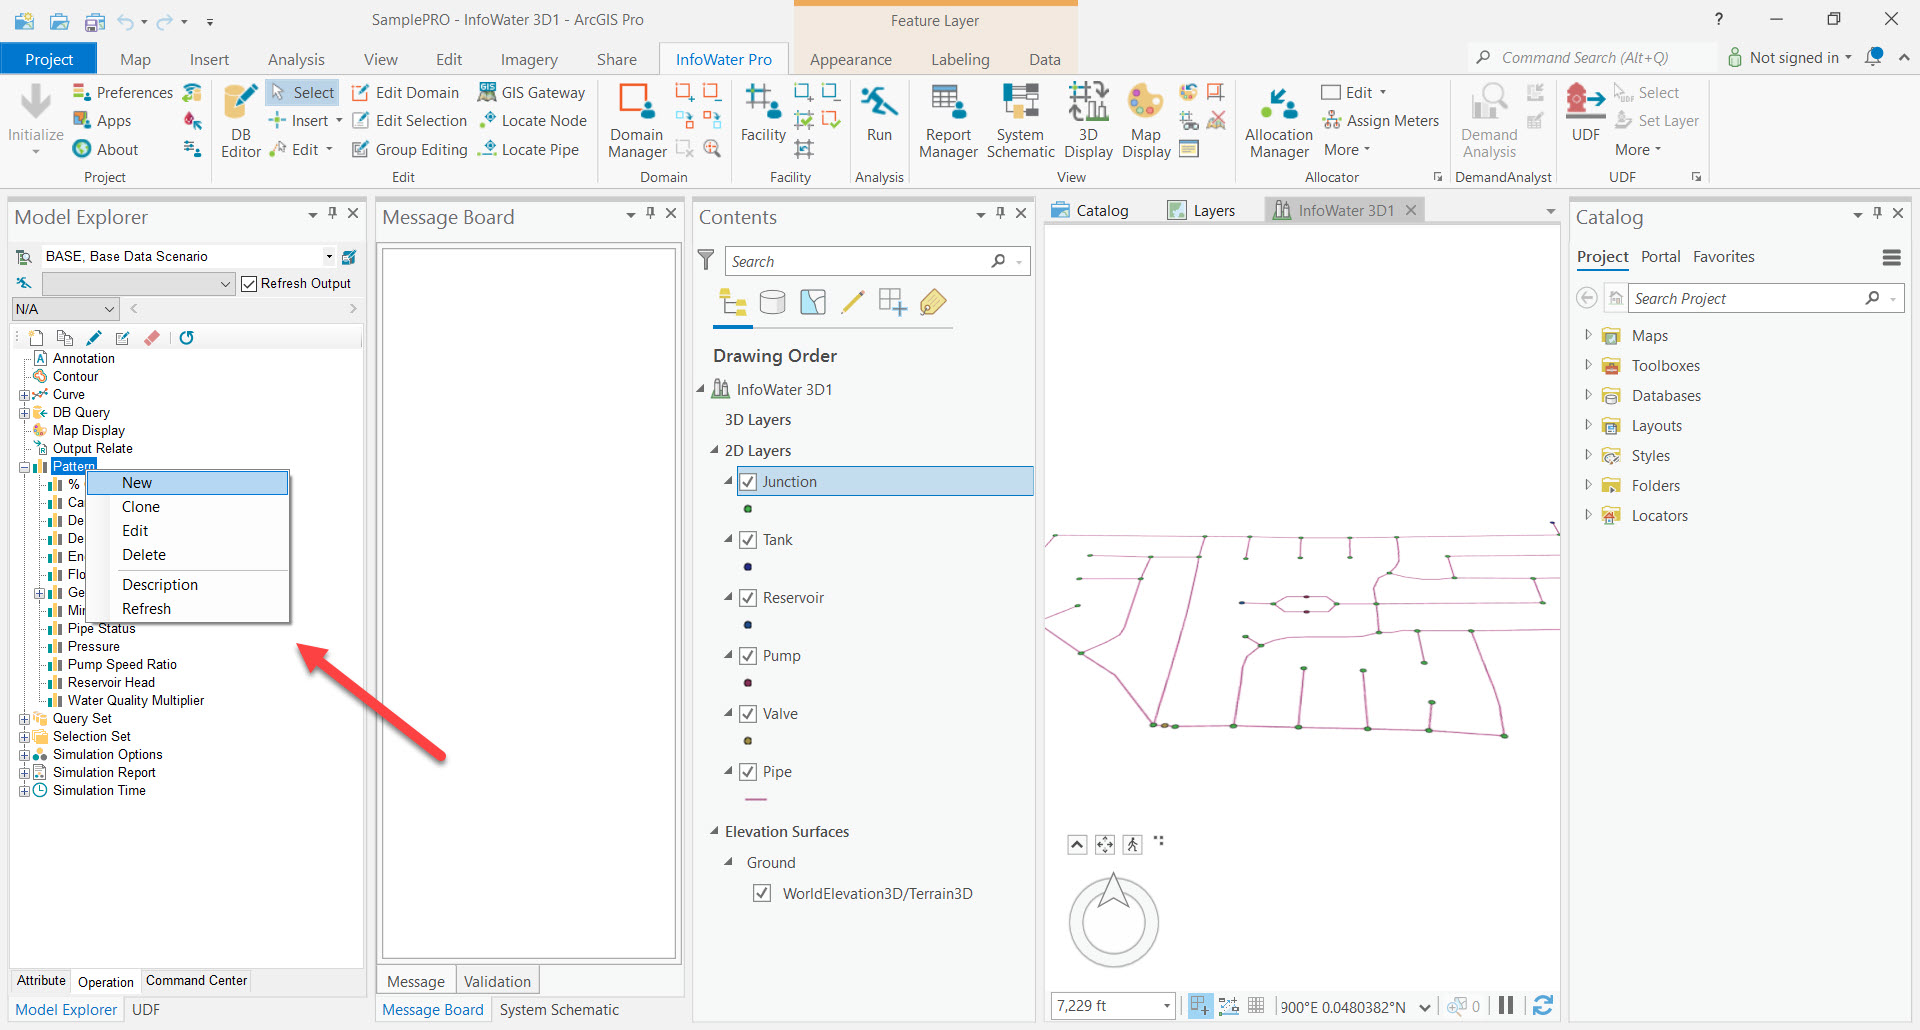
- Select the Operation tab from the Model Explorer, click once on Pattern and then right-click and select the New command.
-
- You are prompted to enter a new ID and description for the energy pattern.
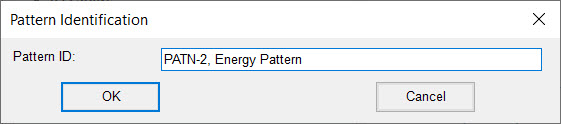
-
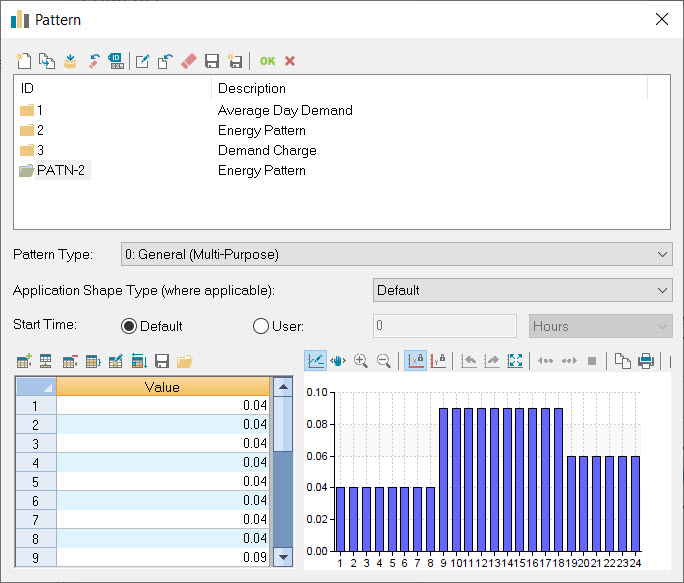
The Pattern dialog box appears on the screen. Enter the twenty-four multipliers the new pattern:
Choose the Set Rows
button and enter a value of “24” and choose “OK”. Enter the pattern factors. As you add the charging rates the graph will be shown on the dialog box. Press the TAB key to apply the change. Click on the Save
button at the top of the dialog box to apply the factors to pattern 2.The following illustrates how the energy rate pattern should appear on the dialog box when properly entered.
-
Choose the
button to close the Pattern dialog box. Energy charge pattern 2 now contains 24 multipliers and is ready for use.
Step 3: Assign Energy Data to Each Pump
Pump efficiency curves and energy patterns are assigned to pumps one pump at a time. Perform the following step for both pump 200 and pump 210. Both share the same energy charge pattern but have different efficiency curves.
Select and Assign an Efficiency Curve and Energy Pattern
- Click on the Select Element
 icon from the InfoWater Edit Network toolbar, place the cursor on pump 200 and then press the left mouse button.
 - Click on the Tools
 icon of the Model Explorer - Attribute Tab window and then choose the Energy Pattern command. The Pump Energy dialog box appears on the screen.
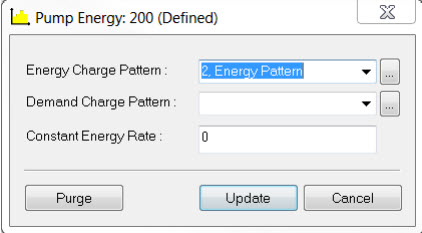
 - On the Pump Energy dialog box, choose “2, Energy Pattern” for the Energy Charge Pattern. For this tutorial, ignore the Demand Charge Pattern and Constant Energy Rate fields.
- Choose “Create” to close the Pump Energy dialog box. The Pump Energy dialog box for Pump 200 appears as:
-
- Click on the Tools
icon of the Model Explorer - Attribute Tab window and then choose the Energy Efficiency command. The Pump Efficiency dialog box appears on the screen.
- On the Pump Efficiency dialog box, choose Quadratic Curve in the Curve Type area.
- Choose “1, Efficiency - Pump 200” for the Curve ID field for pump 200.
- Click on the Insert button to add the selected curve to the efficiency data set for the current pump. The Pump Efficiency dialog box for pump 200 appears as shown below.
- Choose the Create button to close the Pump Efficiency dialog box. Repeat steps 1 through 9 for the second pump 210. Remember that both pumps share the same energy pattern yet have unique efficiency curves (use Curve ID 2 for Pump 210 in the Pump Efficiency dialog box).
Step 4: Perform Energy Costing Analysis
Run an Energy Costing Simulation
Energy cost simulations are controlled with the Run Manager and the Simulation Options dialog boxes.
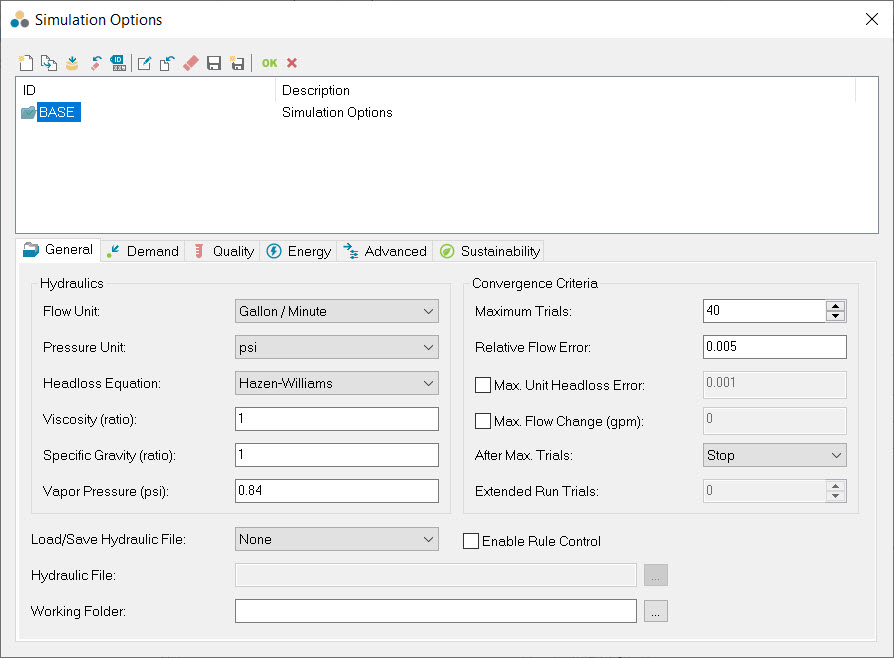
- Select the Operation tab from the Model Explorer, select the Simulation Options > Base Simulation Options and then double click on Base Simulations Options. The Simulation Options dialog box appears on the screen:
-
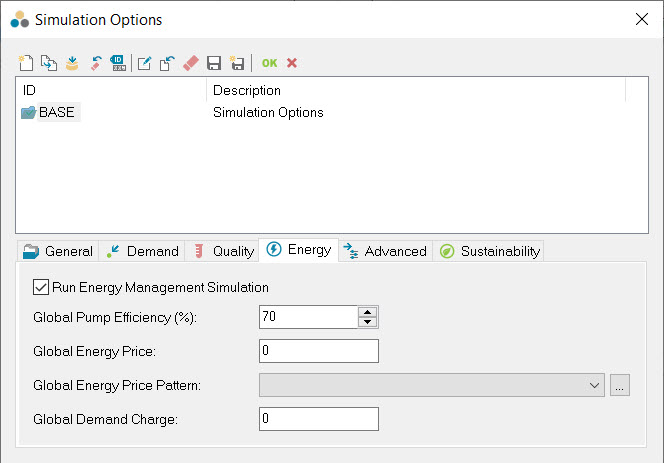
- Select the Energy tab and click on the Run Energy Management Simulation check box. The dialog box should appear as shown below. Close the Simulation Options dialog box by choosing the
button.
-
- Click on the InfoWater Pro
 button and from the Tools
menu, choose the Run Manager command.
button and from the Tools
menu, choose the Run Manager command. - The Run Manager dialog box appears on the screen. Note that energy costing simulation options rely on the Standard simulation options; there is no Energy. simulation option tab on the Run Manager dialog box. Energy costing simulations are based entirely on your hydraulic analysis options and the energy and efficiency data you specified in previous tutorial steps.
- Choose the Standard tab and use the current simulation parameters (report options, hydraulic simulation options, and time setting options).
- Choose the Run
 button at the top of the dialog box. Upon completion of the energy costing simulation, the Output Source Status Indicator (the traffic light) should indicate green.
 - Close the Run Manager dialog box by choosing the
button.
Refer to the Energy Management topic in the Online InfoWater Pro Help for more information on energy management and costing analysis.
Review and Analyze Results
InfoWater Pro provides three separate model results for each pump analyzed, all of which are available from the *ACTIVE*:STANDARD Output Source on the Report Manager. The results include an Energy Cost report, a Demand Cost report (if demand charge data has been entered), and an Energy Summary report. The illustration below shows the Energy Summary report in the Report Manager.
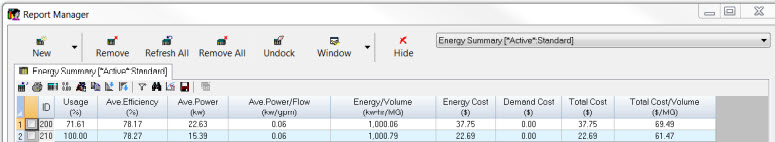
- Usage - Percentage of time the pump is used (turned on) during the simulation period, percent (%).
- Average Efficiency - Average active (when pump is on) pump efficiency for the simulation period, percent (%).
- Average Power - Average active (when the pump is on) pump required power for the simulation period, kW.
- Average Power/Flow - Average required power per unit of flow rate pumped for the simulation period, kW/flow unit.
- Average Energy/Volume - Average energy consumed per unit volume of water pumped for the simulation period, kW-hr/MG (or kW-hr/ML).
- Energy Cost - Total cumulative pump energy operating cost reported for the simulation period, $ (or other cost unit).
- Demand Cost - Total demand cost for the simulation period, $ (or other cost unit).
- Total Cost - The sum of energy and demand cost, $ (or other cost unit).
- Total Cost/Volume - Total pumping cost per unit flow volume pumped for the simulation period, $/MG ($/ML).
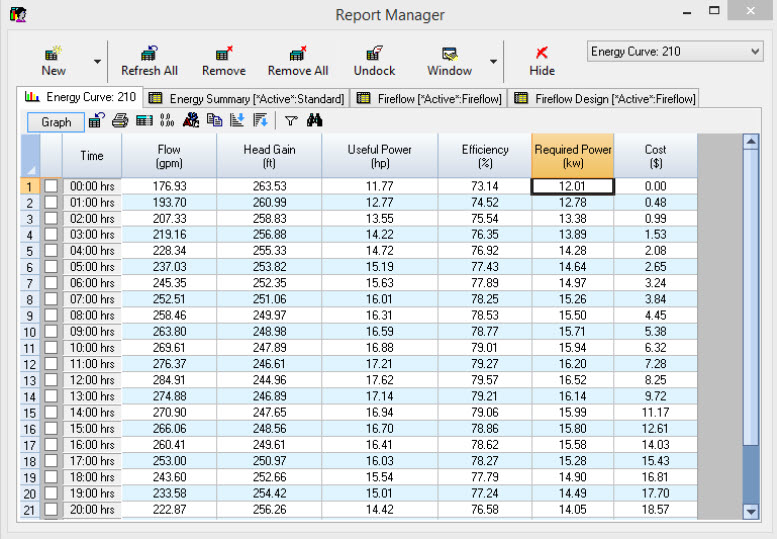
Use the Energy Cost report available from the Report Manager to view the temporal variation in pump discharge flow, discharge head, useful power, efficiency, required power, and aggregated cost for any timestep of the simulation period.
Use any of the query and review tools (such as Filter and Sort) on the Report Manager to analyze your energy management results. Refer to the following help topic for more information on using the Report Manager.
Use the graphing tools available from the Report Manager to review energy cost simulation results. To do this, follow the steps below:
- Click on the InfoWater Pro
button and from the Tools
menu, choose the Report Manager or alternately choose the icon from the InfoWater Control Center toolbar. On the Report Manager, choose the New button.
- When the Output Report & Graph dialog box appears on the screen, select *ACTIVE*:STANDARD in the Available Output Sources area. Click on the Graph Report button, select the Energy Curve graph, and then click on the Open button.
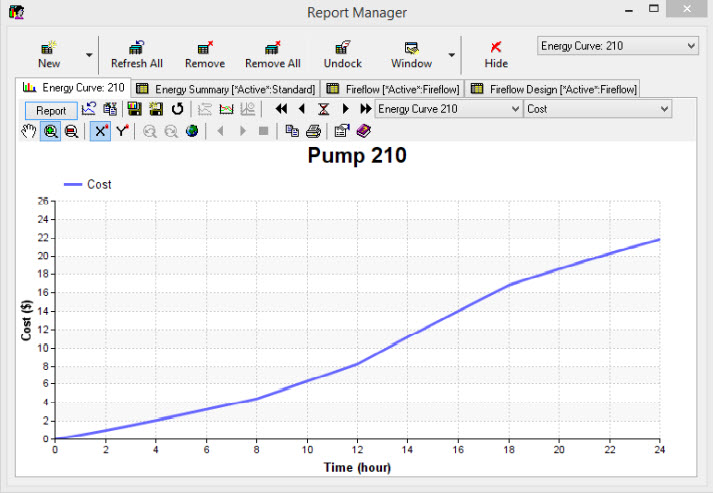
- You are then prompted to select a pump. Move and place the cursor on the desired pump (e.g., pump 210) and press the left mouse button.
- When the Energy Curve Graph appears on the screen click on the Cancel button to close the Output Report & Graph dialog box (if necessary).
- A graph appears on the screen showing the pump discharge flow as a function of time for the selected pump. You can choose to display any desired variable (discharge flow, discharge head, useful horsepower, efficiency, required power, and accumulated cost) from the drop-down list above the graph.
You can obtain a tabular report by pressing the Report button.