This tutorial introduces InfoWater Pro's Model Scenario Management capability. Using InfoWater Pro's Scenario Explorer, you can develop numerous alternative representations of your distribution system, store those alternatives individually, quickly retrieve and analyze those scenarios, and compare modeling results.
By default, when you work in InfoWater Pro, you are using a scenario entitled “BASE”. The data you have developed and analyzed up to this point in the Quick Start tutorial (including fireflow and energy management) have been part of this BASE scenario.
Whichever scenario is currently loaded (i.e., whose associated data is loaded into the open InfoWater Pro project and is available for editing, simulation, and analysis) is referred to as the “ACTIVE” scenario. Because the BASE scenario is currently loaded, it is referred to as the “ACTIVE” scenario. Until you decide to start developing custom scenarios, you will always be working with the BASE scenario.
Scenario Example – Planning for Future Development
Add New Network Components
A developer is proposing a new subdivision in the community. Proposed date of construction is sometime in the future. You need to add that new development to the model and determine system performance given that new development. In this tutorial, you will create three custom scenarios.
- Future Demands - No New Development – The first scenario represents your distribution system without the new development, but with increased demands forecasted for the future.
- Future Demands + New 800 gpm Development – The second scenario represents the same future demands but includes the proposed facilities and the demand associated with the proposed development.
- Future Demands + New 1,200 gpm Development – The third scenario is similar to the second, but uses a larger demand for the new development.
Upon running each of the three separate scenarios, you will use several tools to compare system performance among the three scenarios.
Step 1: Add New Development to the Model Add New Network Components
The first step is to add piping associated with the new development to the tutorial model. At this stage of planning, a very simple piping representation is sufficient. You will add two pipes representing the planned connections to the existing system and will add a single junction node representing the estimated demand at the new development. The two pipes and one junction node representing the future development will be distinguished from existing components by flagging the three new components with a Zone value of “Proposed”.
Open and Initialize the Model
- Open your tutorial model, and click on the
InfoWater Pro
 button to initialize the model.
Note: This tutorial is a continuation of the model used in the main Quick Start Tutorial, and you are expected to use the completed model from the tutorial as the starting basis for this Scenario tutorial. If you have not already completed the Quick Start Tutorial, Innovyze strongly recommends that you complete it first before you attempt to work through this extended tutorial on Scenario Management. If you have not completed the Quick Start Tutorial, please use the Sample.aprx model in the Quick Start Tutorial Example files for use with this tutorial, but you will have to use different scenario names as the scenarios and elements are already added.
Add Additional Elements
NOTE: Please Review Step 3 of the Quick Start tutorial if you need further detail of how to manually add new elements to the model.
- Click on the
Insert
 button drop-down menu from the
Edit Group in the InfoWater Pro ribbon and select the
Insert Junction command.
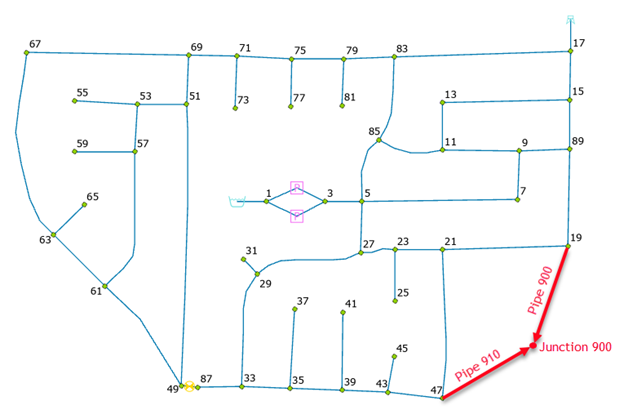
- With the Insert Junction command active select the location shown in the image above and Name the new Junction 900.
- Populate the Elevation, attributes for the new Junction 900 shown in the table below. The Demand1 and Pattern1 fields will be populated in a later step.
-
Insert Pipe 900 from Junction 19 to Junction 900.
-
Insert Pipe 910 from Junction 47 to Junction 900.
- Using the Select command form the Model Explorer, select Pipe 900 in the Model Explorer and populate the Diameter, Length, & Roughness attributes for Pipe 900 per the table below. Repeat the attribute assignment for Pipe 910 as well.
| Junction Attributes | |||
| Junction ID | Elevation | Demand 1 | Pattern 1 |
| 900 | 110 | 800.00 | 1, Average Day Demand |
| Pipe Attributes | |||||
| Pipe ID | Start Node | End Node | Diameter (in) | Length (ft) | Roughness Coefficient |
| 900 | 19 | 900 | 12.00 | 235 | 130.00 |
| 910 | 47 | 900 | 8.00 | 215 | 130.00 |
Flagging Proposed Elements
Edit the Zone field to store a flag indicating that the new components (i.e., junction 900 and pipes 900 and 910 as shown above) are proposed.
- Click on the
Select Element
 icon from the
Edit group in InfoWater Pro
ribbon, place the cursor on junction 900 to make this the active element.
- In the Information section of the Model Explorer - Attribute tab window, click once on the Zone field and enter "PROPOSED". NOTE: Make sure "PROPOSED" is in all capital letters to properly work with the Query.
- Finally, click once on the
Save
 button in the
Model Explorer - Attribute tab window. Repeat the above procedure for the two other components, Pipes 900 and 910 to populate the Zone field as "PROPOSED".
Adding Demand to Junction Nodes
To add a baseline demand for junction 900, perform the following:
- Click on the
Select Element
 button from the
Edit group in the InfoWater Pro ribbon, place the cursor on junction 900, and then click the left mouse button.
- In the Modeling section of the Model Explorer - Attribute tab window, click once on the Demand 1 field and enter “800”. Moreover, click once on the Pattern 1 field and use the drop-down list box to select the “1” pattern.
Step 2: Create Scenario to Store Future Demands
Your first custom scenario will contain the following:
- Only existing facilities (not the new junction and two new pipes) – You will use a database query to exclude proposed facilities from this first scenario.
- Future demands – You will adjust existing demands by a factor of 1.4 for the existing junctions in this scenario.
Create the New Scenario
- Select the
Scenario Explorer
 button from the Model Explorer. The Scenario Explorer dialog box appears on the screen.
- The folder entitled
 BASE, Base Scenario Data is highlighted. This is your default and your active (currently loaded) scenario. Note that the data sets associated with the BASE scenario are also called “BASE”. Each data set is a grouping of modeling data. You can create and load any data set with a given scenario. The Blue Scenario Highlight
 will indicate the active scenario and the parent scenarios. The Lowest Scenario Highlighted in Blue is the Active Scenario.
-
Create your first custom scenario by clicking on the New Scenario
 button. When prompted, enter a scenario name and description (separated by comma) of “FUTURE1, Future Demands – No New Development”. Click once on the
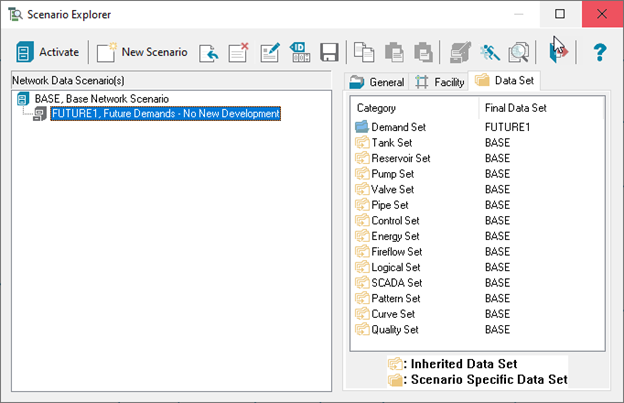
OK button to close the New Data Scenario dialog box. The FUTURE1 scenario is now a child of the BASE scenario as shown in the Scenario Explorer dialog box below. NOTE: Datasets for a child scenario can be set to be either Inherited from the Parent Scenario or they can use a Scenario Specific Dataset. An Inherited Dataset will update automatically in the child scenario to match if changed in the Parent Scenario, while a Scenario Specific Dataset will not change if the Parent scenario is changed. The icon shown next to the dataset will indicate which type has been selected for that dataset
 . To change from a Scenario Specific dataset to Inherited, right click on the dataset in question and select "Inherited". If you open the specific Dataset browser with a double click on the dataset Category name or by right clicking and choosing the
Select option and select a specific dataset so it is highlighted and select the green
 button, it will reset the dataset type to be Scenario Specific. See
Scenario Explorer - Dataset for more details.
Create a Unique Demand Set to Store Future Demands
Two elements of the new FUTURE1 scenario will be unique. You will first create a unique demand set to store future demands.
- While the Scenario Explorer dialog box is open and the new FUTURE1 scenario is selected, select the
Data Set tab and double-click on
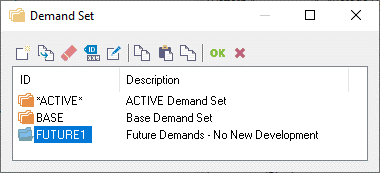
 in the Category area. The Demand Set dialog box appears on the screen.
- You will clone the
Active Demand Set, which contains your current demands. Select *ACTIVE* and click on the
Clone
 button (second from the left at the top of the Demand Set dialog box). When prompted, enter the name and description of the new demand set “FUTURE1, Future Demands – No New Development”. Click on the
OK button of the New Demand Set dialog box.
- With the new FUTURE1 demand set highlighted in blue, click once on the green
 button to close the Demand Set dialog box and to return to the Scenario Explorer dialog box.
- You will now note that the FUTURE1 demand set (in the Data Set area) is associated with the FUTURE1 scenario. The demand set for this scenario is no longer inherited from its parent; it is unique to this scenario. Currently however, the FUTURE1 demand set is storing existing demand values. The Scenario Explorer dialog box should appear as follows.
Create a Unique Facility Set Excluding Proposed Network Elements
The facility tab of the Scenario Explorer defines which elements are active for that given scenario. You will now define a facility set representing existing facilities. Earlier in this scenario tutorial you added two pipes and a junction node and flagged those elements with a Zone value of “PROPOSED”. Using an InfoWater Pro Query Set (collection of database query statements), you can exclude the proposed components. Note: See the Scenario Explorer - Facility tab for further details regarding the Facility Tab options.
-
Click on the Preferences
 button in the
Project Group of the
InfoWater Pro ribbon. From the
Operation Settings tab, select the
Auto Pipe Node Inclusion box to be on.
NOTE: The Auto Pipe Node Inclusion check box will allow a Facility Query Set to only use a single Pipe Query rather than to use 6 separate queries with one for each element type. This can greatly simplify managing fields used in Facility Query Sets as only Pipe fields would need to be managed. When checked on the Model will automatically select Node elements at the endpoints of the pipes selected by the by the Facility Query Set to be active when the scenario is made active. But please note that if the Query set contains any Node element query the software will not use the Auto Pipe Node Inclusion and will expect the Facility Query Set to select all element types.
- On the Scenario Explorer dialog box with the FUTURE1 scenario selected, choose the Facility tab. When the Facility tab appears, choose the Query Set option. One query set has been prepared for you, entitled “EXISTING – Existing Facilities”. Choose this query set.
-
It is suggested that you review the contents of this query set before continuing. Choose the Browse
 button to the right of the drop-down list to open the Query Set dialog box. You will note that the query set is comprised of six individual query statements entitled “EX1” through “EX6”. Examine the first query statement by clicking once on “EX1” in the Query ID panel on the dialog box. You can now examine the contents of the query. The query should appear as (the symbol “ < >” designates “not equal to”):
JUNCTION→ZONE < > 'PROPOSED' The other five queries have an identical structure and represent the other five InfoWater Pro network component types (pipes, pumps, valves, tanks, and reservoirs).
-
To illustrate the advantage of using the Auto Pipe Node Inclusion option from the Preferences, select New on the Query Set box and name the New Query Set as "FAC_EXISTING, Existing Facilities 2".

-
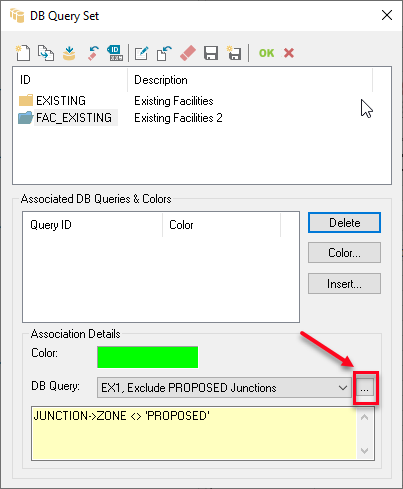
When the DB Query Set box opens and with the new FAC_EXISTING Query Set Selected, click on the Browse
 button in the DB Query section to open the DB Query List.
-
Select the "EX2" query for Pipes and right click and select the Clone option. Name the New Query "EX_PIPES, Existing Pipes" and select OK to create the query.

Note: Making use of Queries that have names that indicate what they represent can be very useful and helpful in managing a model. The EX_PIPES Query by Name tells us that is a Pipes Query for Existing Pipes. This is much more meaningful than the "EX2" which you would have to investigate further to learn it is for Pipe elements. Keep this in mind as a tip that can help make a model more user friendly.
-
With the EX_PIPES query selected click on the green
 button. This will add the EX_PIPES query to the FAC_EXISTING Query Set. If all went properly the FAC_Existing Query set should appear as shown below.
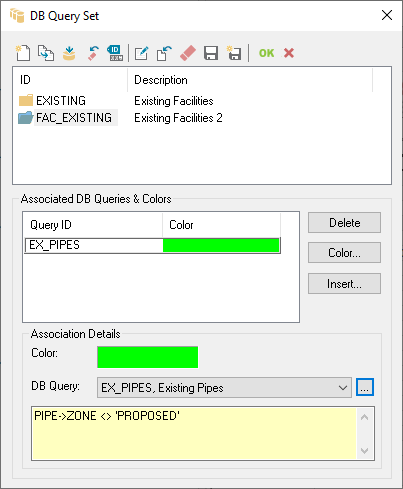
Note: If any other Queries were accidentally added to the "Associated DB Queries & Colors" List besides the EX_PIPES, select that query and click Delete to remove it.
-
Close the Query Set dialog box by clicking on the OK button and return to the Scenario Explorer dialog box.
-
Before you close the Scenario Explorer by clicking on the Exit
 button, as indicated by the BASE scenario that is still highlighted in blue
 .
.
Step 3: Activate (Load) the First Scenario and Modify Your Demands
To modify the demand data in your new scenario, you must activate that scenario. When activating a scenario, the current data in your Tutorial project (BASE data sets) are replaced by the data sets associated with the new active scenario.
Activate the FUTURE1 Scenario
You can activate a scenario directly from the Scenario Explorer dialog box or from the InfoWater Pro Model Explorer. The latter is illustrated here.
- Choose the FUTURE1 scenario from the drop-down list box on the InfoWater Pro ribbon, and click on the
OK button on the Confirmation dialog box.

When you activate the FUTURE1 scenario, InfoWater Pro applies the database query statements in the FAC_EXISTING Query Set to include and exclude network facilities in the model. Notice that when you load the FUTURE1 scenario the proposed facilities are no longer active and appear light gray. They remain in the project but are not active for the current scenario. Finally, InfoWater Pro loads your custom demand set FUTURE1.
Adjust Baseline Demands
Now that your custom demand set is loaded and active, you can adjust those demands to represent future water usage without overwriting your existing demands, which are stored in the BASE demand set.
- Click on the
DB Editor
 button from the
Edit Group of the
InfoWater Pro ribbon to open the DB Editor.
- From the Element Hydraulic Data section, choose the Junction Demand table. Select Entire Table in the Data Scope area (with Edit Active Elements Only checked. With this checked on, only active junctions will show and proposed junctions will not be included, to be displayed and available for editing), and choose OK. The Junction Demand table appears on the screen.
- To adjust the contents of an entire field, in this case DEMAND1, click once on the column header with the mouse. The entire column should be highlighted.
- You adjust all baseline demands by increasing the current demands by a factor of 1.4. Choose the Block Editing button while the DEMAND1 field remains highlighted. When the Block Editing dialog box appears on the screen, choose the Multiply By operation, enter “1.4” for the value, then choose OK. All demands should now be increased by a factor of 1.4.
- Select the
Save
 button and then choose the
Close button at the top of the DB Editor window. Close the
DB Editor by selecting the
Exit
 button at the top of the window.
Note: When you create a new scenario, the Facility Tab will default to using the Active Network option. This will keep all elements that were currently active in the active scenario as the same elements active in the new scenario, but should be used with caution as it will keep active whatever elements are active at the time in the last scenario used when you switch to this scenario. This can easily result in unexpected changes in what elements are active in the given scenario. As such it is recommended to always review and adjust the Facility Tab when making a new scenario to avoid confusion. The most commonly used Facility options for new scenarios include The Query Set option and the Intelli-Selection options as these give the user better control over which elements should be active in the new scenario.
Step 4: Run a Model Using the First Custom Scenario
You have created your first custom scenario, representing the existing network components with estimated future demands. Now, while this custom scenario is active and its associated data loaded into the open InfoWater Pro project, run the model to obtain hydraulic and water quality results.
Run the Model
Now run a standard (hydraulic and water quality) simulation while the FUTURE1 scenario is active.
- Select the
Run
 button from the
Analysis Group in the InfoWater Pro ribbon. The Run Manager dialog box appears on the screen.
- Make sure the Run Manager is currently on the Standard tab. Using the BASE options for Report Options, Simulation Options, and Time Settings, select the Run
 button to run the model. If the run is successful, the Output Source Status Indicator (The Stoplight) should show as green.
- Close the Run Manager dialog box by clicking on the OK button.
.Note that the Name of the Output Source that will store the simulation results is *ACTIVE*:STANDARD. The Active Standard Output Source will store the results of the FUTURE1 scenario simulation. Note that the FUTURE1 scenario will use the same simulation options and time settings (duration, timesteps) as the BASE, or default, scenario. Although not instructed to do so as part of this tutorial, you could associate a unique set of simulation options with this custom scenario.
Review Model Results for the First Custom Scenario
Review the results of the simulation using the Map Display. Please review Step 9 of the Quick Start tutorial if you need assistance in reviewing model output.
Now you will create the next scenario representing future demands, in the Quick Start Tutorial incorporating the new development and then run a simulation with that scenario.
Step 5: Create Scenario to Store Future Demands and New Development
Your second custom scenario will contain the following:
- Existing and proposed facilities – This scenario will include the existing facilities from the original model plus the two pipes and one junction node representing the proposed development.
- Future demands – This scenario will use the same demands as the first custom scenario.
This new scenario will inherit its properties from the first custom scenario. If you were to modify the demands in the first custom scenario, the demands in this new scenario would also be modified.
Create the New Scenario
- Click on the InfoWater Pro button and from the Scenario menu, choose the Scenario Explorer command. The Scenario Explorer dialog box appears on the screen.
- Choose the first custom scenario FUTURE1 by clicking once on the scenario name.
- Choose the
New Scenario
 button. When prompted, enter the name and description for the new scenario, “FUTURE2, Future Demands + New 800 gpm Development”.
- Click then on the OK button of the New Data Scenario dialog box. Because you created the FUTURE2 scenario as a new child of the FUTURE1 scenario, FUTURE2 inherits its properties (data sets) from the FUTURE1 scenario, including the demand set storing future demands. Note the symbol used to indicate that the FUTURE2 scenario demand set is inherited from its parent scenario.
-
Note, however, that scenarios do not inherit their facility set (network components) from their parent. Therefore you must explicitly define the network components that will be activated for modeling when you activate (load) the FUTURE2 scenario. The FUTURE2 scenario will include the entire suite of network components, existing and proposed.
-
On the Scenario Explorer dialog box, choose the Facility tab. When the Facility panel appears, choose the Entire Network option.
Step 6: Activate (Load) the Second Scenario
You can now run a simulation using data from the second scenario.
Activate the FUTURE2 Scenario
You can activate a scenario directly from the Scenario Explorer dialog box or from the InfoWater Pro ribbon. The former is illustrated here.
- Select the scenario FUTURE2 by clicking once on the scenario name.
- Click once on the Activate button. The second scenario is now activated.Note: Observe that the color of the Scenario button for the FUTURE2 scenario changes from a gray color to a blue color. The blue color indicates the scenario is active. All Parent scenarios for this one are also colored blue, but only the lowest Scenario Level colored blue will be currently active.
- Click once on the
Exit
 button to close the Scenario Explorer dialog box.
When you activate the FUTURE2 scenario, InfoWater Pro activates all existing and proposed facilities. Notice on the map display that the two pipes and one junction node added at the beginning of this tutorial re-appear on the screen. This occurs because this scenario used the Entire Network option on the Scenario Facility Tab. The Entire Network option will include all elements in the model and make them active. For this reason, this option often has limited value for most models unless all elements are indeed active for the scenario. No additional data modification is necessary. You may now run a simulation using the FUTURE2 scenario.
Step 7: Run a Model Using the Second Custom Scenario
Run the Model
Now run a standard (hydraulic and water quality) simulation while the FUTURE2 scenario is active.
-
Select the Run
 button from the
Analysis Group in the InfoWater Pro ribbon. The Run Manager dialog box appears on the screen.
- Choose the Standard tab and click on the Run button.
- Close the Run Manager dialog box by clicking on the OK button. Select Yes if asked to switch to the Most Recent Run Output Data.
Note the Name of the Output Source that will store the simulation results is *ACTIVE*:STANDARD. The Active Standard Output Source will store the results of the FUTURE2 scenario simulation.
The previous simulation results, those associated with the FUTURE1 scenario, are automatically moved to a new Output Source entitled FUTURE1:STANDARD.
Review Model Results for the Second Custom Scenario
-
Select the Locate Node
 button in the
Edit group of the InfoWater Pro ribbon. This will open up the Locate Node window. Enter 19 and select the
OK button to close. This will make Junction 19 the active element in the Model Explorer.
-
Click the Graph
 button in the Model Explorer to graph this element in the Report Manager. A graph of Junction 19 should automatically appear.
- From the drop-down of the output field change the selected output from Demand (default) to Pressure. This should now show the active output field as Pressure in the graph.
-
From the Icons in the active junction, select the Reference Graph
 button.
-
Select the "Pressure" References sources tab at the top.
-
Check the box for "Data from Other Output Source(s)" and click on the Select button to open the Select Output Source(s) to Compare box.
-
Select the FUTURE1:Standard from the list and click OK to close. Select OK once again to close the remaining dialog box that is open.
-
The graph should now show Pressure data from the Active FUTURE2 scenario (in the Active:Standard Output) as well as the Pressure Data from the FUTURE1:Standard scenario.
-
Review the graph and notice the impact of the new 800 GPM demand on Node 900 has on the pressure at the nearby Junction 19 that was graphed.
-
Select the Hide
 button to close the Report Manager.
-
Select the Locate Pipe
 button in the
Edit group of the InfoWater Pro ribbon. This will open up the Locate pipe window. Enter 18 and select the
OK button to close. This will make Pipe 18 the active element in the Model Explorer.
-
Click the Graph
 button in the Model Explorer to graph this element in the Report Manager. A graph of Pipe 18 should automatically appear. Keep the Default Output field of Flow as the active output field.
-
From the icons in the active pipe Graph, select the Reference Graph
 button.
-
Select the "Flow" References sources tab at the top.
-
Check the box for "Data from Other Output Source(s)" and click on the Select button to open the Select Output Source(s) to Compare box.
-
Select the FUTURE1:Standard from the list and click OK to close. Select OK once again to close the remaining dialog box that is open.
-
The graph should now show Flow data from the Active FUTURE2 scenario (in the Active:Standard Output) as well as the Flow Data from the FUTURE1:Standard scenario.
-
Review the graph and notice the impact of the new 800 GPM demand on Node 900 has on the flow at the nearby pipe 18 that was graphed.
-
Select the Hide
 button to close the Report Manager.
Review the results of the simulation using the Map Display. We recommend color coding Pipes by Flow and Junctions by Pressure to compare differences. By Switching the Output source from ACTIVE:STANDARD to FUTURE1:STANDARD, you can see the Map display change output without having to switch scenarios. Please review Step 9 of the Quick Start tutorial if you need assistance in reviewing model output and use of the Map Display.
Step 8: Create Third Scenario with Increased Demands for New Development
Your third custom scenario will contain the following:
- Existing and proposed facilities – This scenario will include the existing facilities from the original model plus the two pipes and one junction node representing the proposed development.
- Future demands plus additional demand for new development – This scenario will use the same future demands as the previous scenarios, however you will increase the demand at the new development from 800 gpm to 1,200 gpm. For this you will need to create another new demand set.
This new scenario will inherit its properties from the second custom scenario. If you were to modify the demands in the second custom scenario (FUTURE2), the demands in this new scenario would also be modified.
Create the New Scenario
- Select the
Scenario Explorer
 button from the Model Explorer. The Scenario Explorer dialog box appears on the screen.
- Choose the second custom scenario FUTURE2 by clicking once on that scenario name with the mouse.
- Choose the
New Scenario
 button (second from the left at the top left-hand corner of the dialog box). When prompted, enter the name and description for the new scenario, “FUTURE3, Future Demands + New 1200 gpm Development”. Click on the
OK button on the New Data Scenario dialog box.
- Because you created the FUTURE3 scenario as a new child of the FUTURE2 scenario, FUTURE3 inherits its properties (data sets) from the FUTURE2 scenario, including the demand set storing future demands. However, you now need to create and activate a new demand set to store the future demands for the entire network in addition to the increased demand at the new development.
- Before creating the new demand set, indicate that the new scenario will utilize the entire suite of network components. On the Scenario Explorer dialog box, choose the Facility tab. When the Facility panel appears, choose the Entire Network option.
Create a Unique Demand Set to Store Increased Demand at the Proposed Development
- While the Scenario Explorer dialog box is still open and the new FUTURE3 scenario is selected, click on the Data Set tab and then double-click on Demand Set. The Demand Set dialog box appears on the screen.
- You will clone the active demand set which contains the future demands including 800 gpm at the new development – junction node 900. Select *ACTIVE* and click on the
Clone
 button (second from the left at the top of the Demand Set dialog box). When prompted, enter the name and description of the new demand set “FUTURE2, New Development 1200 gpm”. Click on the
OK button of the New Demand Set dialog box.Note: It is recommended that consideration be given to use Dataset Names that in general match the scenario name where the scenario is used for most models. This can often help the Modeler better keep track of scenario specific data and which scenario they are used for because the Scenario and the dataset used match. The use of FUTURE1 demands for Scenario FUTURE2 and FUTURE2 demands for Scenario FUTURE3 could lead to some potential confusion for some users and should in general be considered to be avoided when possible to make models more user friendly.
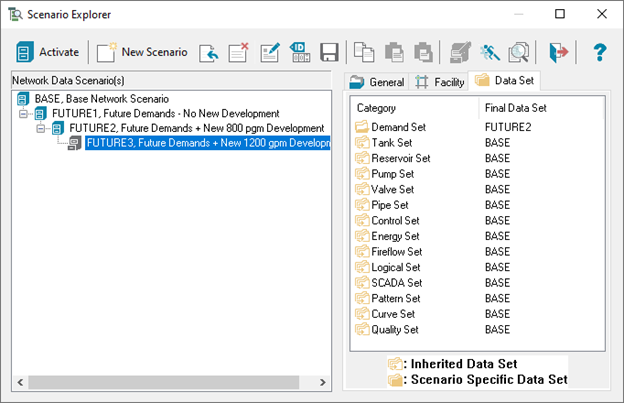
- Choose the OK button to close the Demand Set dialog box and return to the Scenario Explorer dialog box. You will now note that the FUTURE2 demand set is associated with the FUTURE3 scenario.
- The Scenario Explorer dialog box should now appear as follows.

Step 9: Activate (Load) the Third Scenario
You can now run a simulation using data from the third scenario FUTURE3.
Activate the FUTURE3 Scenario
You can activate a scenario directly from the Scenario Explorer dialog box or from the InfoWater Pro ribbon. The former is illustrated here.
- Select the third scenario FUTURE3 by clicking once on the scenario name.
- Click once on the Activate button. The third scenario is now activated.
- Click once on the
Exit
 button to close the Scenario Explorer dialog box.
When you activate the FUTURE3 scenario, InfoWater Pro activates all existing and proposed facilities. Moreover, InfoWater Pro loads your custom demand set “FUTURE2 – New Development 1200 gpm”, which at this point in the tutorial contains the future demand values. The new proposed node still has a demand of 800 gpm.
Increase Demand at the New Development
Before continuing, increase the demand at junction 900 from 800 gpm to 1,200 gpm:
- Click on the Locate Node
 command form the
Edit Group of the InfoWater Pro ribbon. Enter "900" and click OK. Junction 900 should now be the active element in the Model Explorer.
- In the Modeling section of the Model Explorer - Attribute Tab window, click once on the DEMAND 1 field and enter “1200”.
- Finally, click once on the
Save
 button in the Model Explorer - Attribute Tab window.
The adjusted demand is automatically saved in the active demand set, “FUTURE2, New Development 1200 gpm”.
Note: If the Auto Record Saving box is checked in Preferences dialog box (see the Project Group in the InfoWater Pro ribbon) under the Operations Settings tab, changes made in the Model Explorer fields should automatically save. If this check box is left unchecked, then any change made would need to be saved in the Model Explorer manually. For this reason, Innovyze recommends checking this option on for normal model operations.
Step 10: Run a Model Using the Third Custom Scenario Run the Model
Now run a standard (hydraulic and water quality) simulation while the FUTURE3 scenario is active.
- Select the
Run
 button from the
Analysis Group of the InfoWater Pro ribbon. The Run Manager dialog box appears on the screen.
- Choose the Standard tab and click on the
Run
 button. Upon successful completion of the simulation, the Output Source Status Indicator (the stoplight) should show green.
- Close the Run Manager dialog box by clicking on the OK button. Select Yes if asked to Switch to the Most Recent Run Output Data.
Note the Name of the Output Source that will store the simulation results is *ACTIVE*:STANDARD. The Active Standard Output Source will store the results of the FUTURE3 scenario simulation.
The previous simulation results, those associated with the FUTURE2 scenario, are automatically moved to a new Output Source entitled FUTURE2:STANDARD. Upon completion of this simulation, you should have the following Output Sources available:
- BASE:STANDARD – The original network, prior to adjusting demands and adding new facilities.
- FUTURE1:STANDARD – The existing network, excluding proposed facilities, with the original demands increased by a factor of 1.
- FUTURE2:STANDARD – The entire network including proposed facilities and the same demands as the FUTURE1 scenario with an additional 800 gpm at the new development.
- *ACTIVE*:STANDARD – The entire network including proposed facilities and the same demands as the FUTURE1 scenario. For this scenario, the demand at the new development has been increased from 800 gpm to 1200 gpm.
Review Model Results for the Second Custom Scenario
Review the results of the simulation using the Map Display after the FUTURE2 run completion.
Similar to what was completed after the FUTURE2 run, let's compare run results for Junction 19 and Pipe 18.
- Open the
Report Manager
by clicking on the Report Manager
 button from the
View Group of the InfoWater Pro ribbon. Graphs created from our previous runs will still appear in the Report Manager but are not yet updated with the latest run results.
- To refresh the Output data to the latest Output run for the FUTURE3 scenario, select the
Refresh All
 button. Once refreshed, the ACTIVE:Standard output will now reflect the FUTURE3 scenario RUN.
- Review both graphs and notice the Drop in Pressure at Junction 19 is even greater and that the Flow difference seen in Pipe 18 is also greater than was seen after the FUTURE2 run comparison.
Note: (OPTIONAL) This drop in pressure appears to indicate that the proposed development is identifying some deficiency in the current system. While this is beyond this tutorial, if you graph the Tank 103 the tank appears to be undersized for the future Demand or the pumps provided are undersized to handle the proposed large development.
Try Increasing the Tank Diameter to 200 ft as this will greatly increase the Storage capacity of the system. You can re-run all of the scenarios quickly by using the Command Center tab of the Model Explorer under
Tools - >
Batch Simulation if interested. In a Batch Simulation make sure to select the FUTURE1, FUTURE2, and FUTURE3 so they are highlighted in Blue before you select the
Run
 button. See below for how the batch run should look before running.
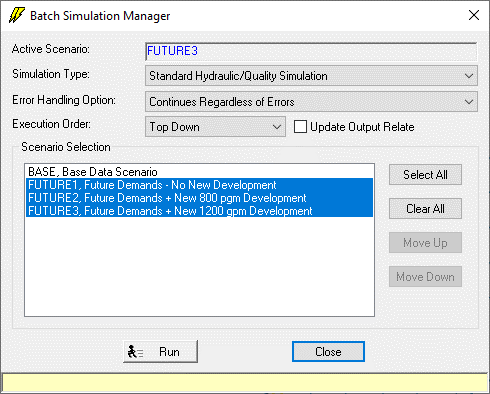
Step 11: Compare Model Results Between Scenarios
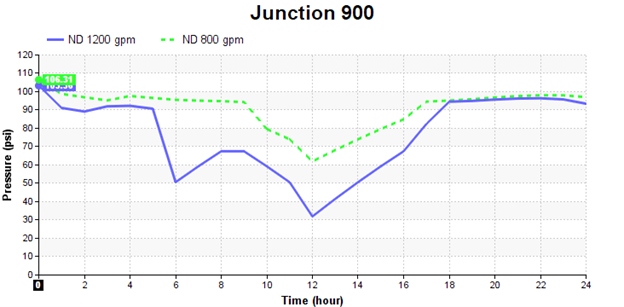
Finally, you will display on the same graph the (time-varying) pressure results for junction node 900 (new development) loaded with an external demand of 800 gpm and 1,200 gpm. You will also create a custom output report showing for every junction node in the system the demand and head associated with both FUTURE2 and FUTURE3 modeling scenarios at any simulation timestep.
Open a Graph for the Proposed Development at Junction 900
- Click on the Report Manager
 button and from the View Group
of the InfoWater Pro ribbon, select the
Report Manager
 command. The Report Manager appears on the screen.
- On the Report Manager, choose the New button. When the Output Report & Graph dialog box appears on the screen, select *ACTIVE*:STANDARD (containing results from your most recent model run) in the All Output Sources area.
- Click on the Graph tab, choose Junction Graph, and then click on the Open button.
- You are then prompted to select a junction node. Move and place the cursor on the new junction node 900. A graph appears on the screen showing the daily demand variation for the selected Junction Node 900.
- When the Junction Graph appears on the screen, the Output Report & Graph dialog box will close.
Now load the output data for junction 900 from the previous scenario run, i.e. FUTURE2:Standard. Click on the Reference Graph
 button. Click on the
Demand Reference Sources tab and check on
Data From Other Output Sources. Click on the Select button. The Select Output Source(s) to Compare dialog box appears on the screen.
- Choose the FUTURE2:Standard Output Source and then choose OK. Select OK again, and the graph now shows the temporal variation in demand for junction 900 for both scenarios.
- From the drop-down list, switch the Output field from Demand to Pressure. Note that by increasing the demand at the proposed development from 800 gpm to 1200 gpm the distribution system will experience a low pressure condition from simulation time period 10:00 to time period 15:00.
Customize the Graph Legend
Finally, customize the graph legend, renaming legend entries such that they are intuitive.
- While the graph is active, click on the
Properties
 button. When the Properties dialog box appears on the screen, click on the
Curve -Active:Standard box to see the options for that Output. Change the Legend Title from "*Active*:Standard" to "ND 1200 gpm, as shown below. The Legend Text dialog box appears on the screen.
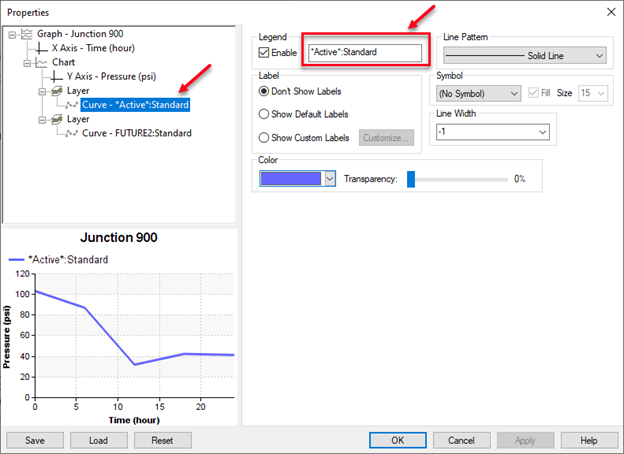
- In the left-most cell of the Legend Text dialog box, replace “*Current*” with “ND 1200 gpm”, representing the pressure at the new development at 1200 gpm base demand. In the right-most cell, replace “FUTURE2:Standard” with “ND 800 gpm”. Choose the OK button to close the Legend Text dialog box.
-
Close the Properties dialog box by clicking on the OK button. The graph legend should now reflect your changes in the Report Manager Graph window.
-
In the Report Manager, select New to open a new Tabular Report. Using the Active:Standard Output Source, select the Tabular Report tab, choose the Junction Report option, and use the default "Complete Report/Graph" for Data Scope. Select Open to open the report.
-
Select the Compare Report
 button from the
Junction Report icon.
- Choose the FUTURE2:Standard Output Source and then choose OK. The report now shows the junction node results for both FUTURE2 and FUTURE3 modeling scenarios.
-
Now customize your report to display only the demand and head results for both scenarios. Select the Format Report
 button from the junction report icon and the Format All dialog box appears on the screen. The Display Columns area initially contains all the output variables for display. Click on the
 button and the output variables are shifted to the Available Columns area. Hold down the CTRL key and select “Demand”, “Demand [FUTURE2:Standard]”, “Head”, and “Head [FUTURE2:Standard]” and select the
 button to add these 4 output fields to the report. The Display Columns area now only shows the four selected output variables.
- Click on the OK button to close the Format All dialog box. The Junction Report now shows the selected junction results for both FUTURE2 and FUTURE3 modeling scenarios. Select Hour 12:00 hrs form the drop-down menu, and scroll to the bottom to see Junction 900 results.
- Close the Report Manager by clicking on the
Hide
 button.
Changing Output Units
With InfoWater Pro, you can change the units of any output variable in any report and graph display. You can even mix US customary and SI units in the same project if you so desire. For this exercise, we will use the Output Unit Manager to display the junction demand in million gallons per day (mgd) and the junction, tank and reservoir head in meter (m).
-
Click on the Model Explorer and select the Command Center tab. Under the Tools menu, choose the Output Unit Manager. The Output Unit Manager appears on the screen as shown below. The Output Unit Manager stores the selected output display units.
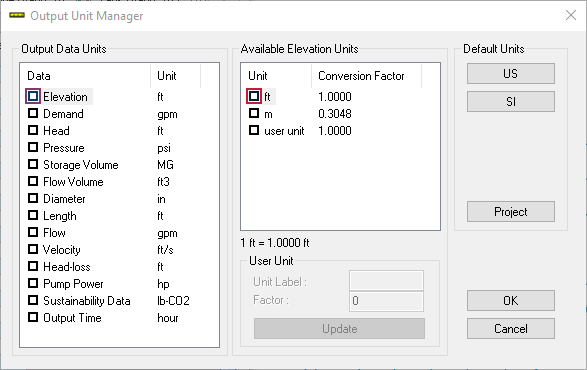
- From the Output Unit Manager dialog box, click on the Demand in the Output Data Units area and select “mgd” from the Available Node Demand Units area.
- Similarly, click on the Head in the Output Data Units area and select “m” from the Available Node Head Units area. Click on the OK button to close the Output Unit Manager dialog box.
-
Select the Attribute tab of the Model Explorer and select any Junction as the active element (if not already on a junction). Notice that under Output section that the Demand now shows as MGD and the Head now shows results in Meters.
Note: It is often good modeling practice to maintain consistent units for Input Units and Output Units to avoid easily getting confused; but it is handy that one can easily change Output units on the fly if so desired. To reset Output Units to match Input units, select the Project
 button in the Output Unit Manager. This will reset output units to match the current model input units.
Refer to the Analyzing Output Results → Output Unit Manager topic in the Online InfoWater Pro Help for more information on specifying units for use on graphs and reports.
Conclusion
Using InfoWater Pro's scenario management capabilities will allow you to take a single InfoWater Pro project, representing your existing distribution system under current average day conditions, and create three additional alternative model representations. These model representations represent your existing system under future demand conditions, your existing system with the proposed development, and the proposed development under significantly increased demands.
You have seen how, after developing modeling scenarios with the Scenario Explorer, you can quickly retrieve each separate scenario and can easily compare the results between the different scenarios.
You have now completed the InfoWater Pro's Extended Tutorial 3: Model Scenario Management. You should now have the skills necessary to develop and analyze distribution system network models with the extensive and powerful suite of tools provided by InfoWater.