Map Display may be used to either color code and/or vary symbol sizes of your data elements such as Junctions, Pumps, Valves, Tanks, Reservoirs, and Pipes based on either their input or output variables. You may also annotate your InfoWater Pro map with the corresponding data value. You can choose the data breaks, different colors, and symbol sizes. This provides a dynamic and powerful way of categorizing your entire project visually based on defined criteria.

Using Map Display in InfoWater Pro
Some examples of Map Display themes:
- Color Coding and/or using different symbol sizes for your nodes based on elevations will give you a quick idea of the topology of your area. You may use this feature to help in identifying zonal separations.
- Color coding and/or using different symbol sizes for your pipes based on diameters, for instance, will provide you with a time-saving tool to determine the correctness of your digitization process. You may also gauge the water levels in your tanks and reservoirs by color coding and/or using different symbol sizes for them based on water level.
- Color coding and/or using different symbol sizes for your elements with the output data will provide a quick means of visually gauging the correctness of your model simulation. Junction pressure color coding will right away tell you about your system deficiencies and inadequacies.
Methodology
There are two methods to color code and/or use different symbol sizes for data elements using the InfoWater Map rendering feature:
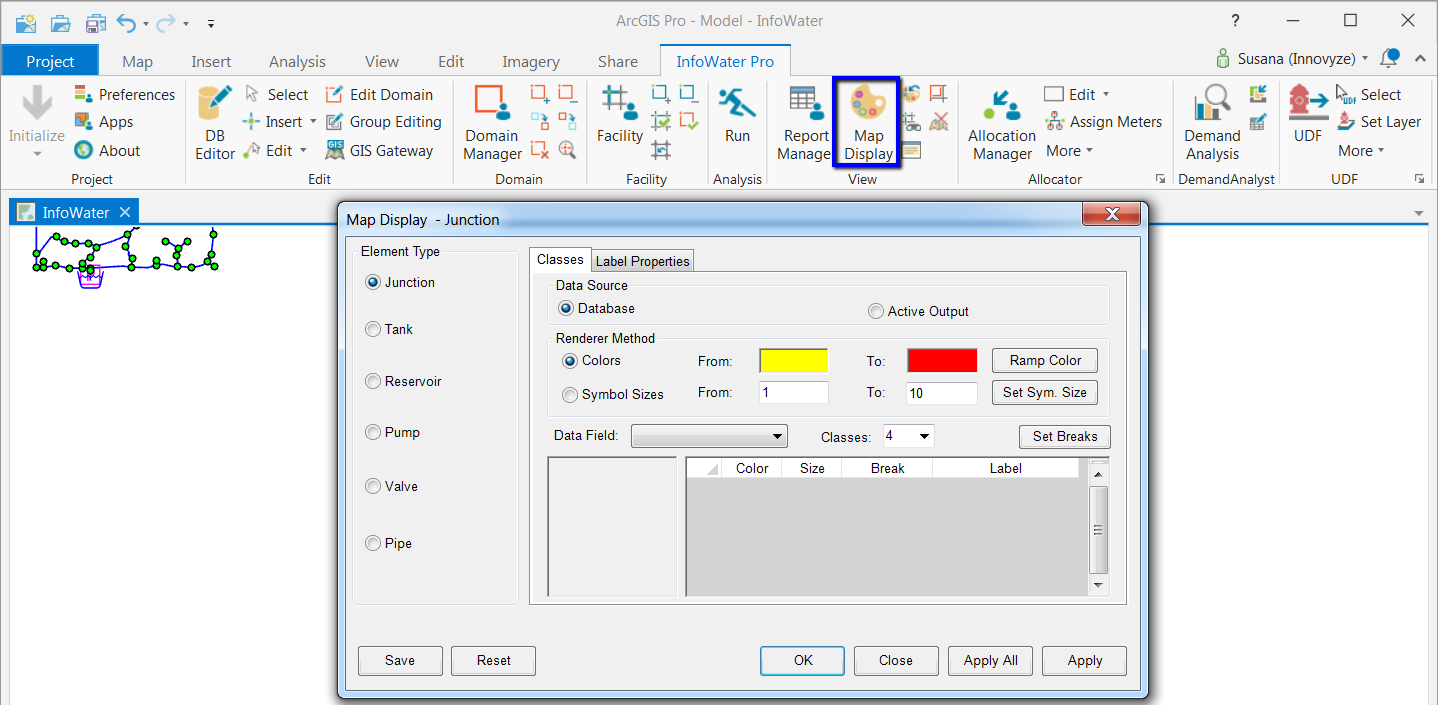
1) Launching the Map Display Manager by clicking on the
Map Display
![]() icon on the InfoWater Pro ribbon or
icon on the InfoWater Pro ribbon or
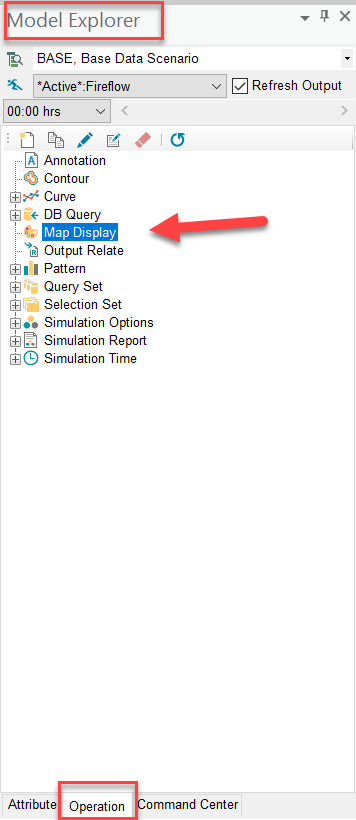
2) Accessing the Map Display themes tree through the Operation tab found in the Model Explorer.

Launch Map Display Manager through icon or InfoWater Drop-Down Menu
- Launch the Map Display Manager by clicking on the
Map Display
 icon on your InfoWater Pro ribbon.
- In the Map Display dialog box, set the map theme settings as follows:
- Choose the Element Type and the Data Source for the annotation.
- Specify the Data Field that will be used to annotate the map and the number of classes.
- For advanced classification options, click Classify.
- Choose the Rendering Method that will be used. You may select between annotating data element based on color or based on symbol size.
- Specify the data breaks and either manually specify the colors and the symbol size breaks or use the From - To option and the
Ramp Color
 button to automatically assign the symbol sizes and the colors to the data elements.
- You may also add text to your annotation. Choose the Label Properties tab if you want to annotate your model with labels. Specify the different options available including the placement and the size of the label. Also specify if you want the units displayed on the map.
- Once all the Map Rendering data has been entered, click
Save
 to save map theme selections to Map Display tree. Click
Apply
 and exit from the Map Display tab. Choose to click
Apply
 if you want to keep the Map Display Manager open and yet annotate the Map at the same time.
- Click on the
Reset Display
 icon to clear the network map from all applied map themes.
Launch Map Display Manager through Operation tab in Model Explorer
- In the
Model Explorer
window, click on the
Operation tab, select
Map Display
 , right click and choose
New.
- Enter an ID and a Description for the new map theme. This will launch your Map Display dialog box.
- In the Map Display dialog box, set the map theme settings as follows:
- Choose the Element Type and the Data Source for the annotation.
- Specify the Data Field that will be used to annotate the map and the number of classes.
- For advanced classification options, click Classify.
- Choose the Rendering Method that you want to use. You may select between annotating your data element based on color or based on symbol size.
- Specify the data breaks and either manually specify the colors and the symbol size breaks or use the
From - To option and the
Ramp Color
 button to automatically assign the symbol sizes and the colors to the data elements.
- You may also add text to your annotation. Choose the Label Properties tab, if you want to annotate your model with labels. Specify the different options available including the placement and the size of the label. Also specify if you want the units displayed on the map.
- Once all the Map Rendering data has been entered, click
Save
 to save map theme selections to Map Display tree. Click
Apply
 and exit from the Map Display tab. Choose to click
Apply
 if you want to keep the Map Display Manager open and yet annotate the Map at the same time.
- Click on the
Reset Display
 icon to clear the network map from all applied map themes.
Color Coding will not work for a domain. InfoWater Pro will always color code the entire network.
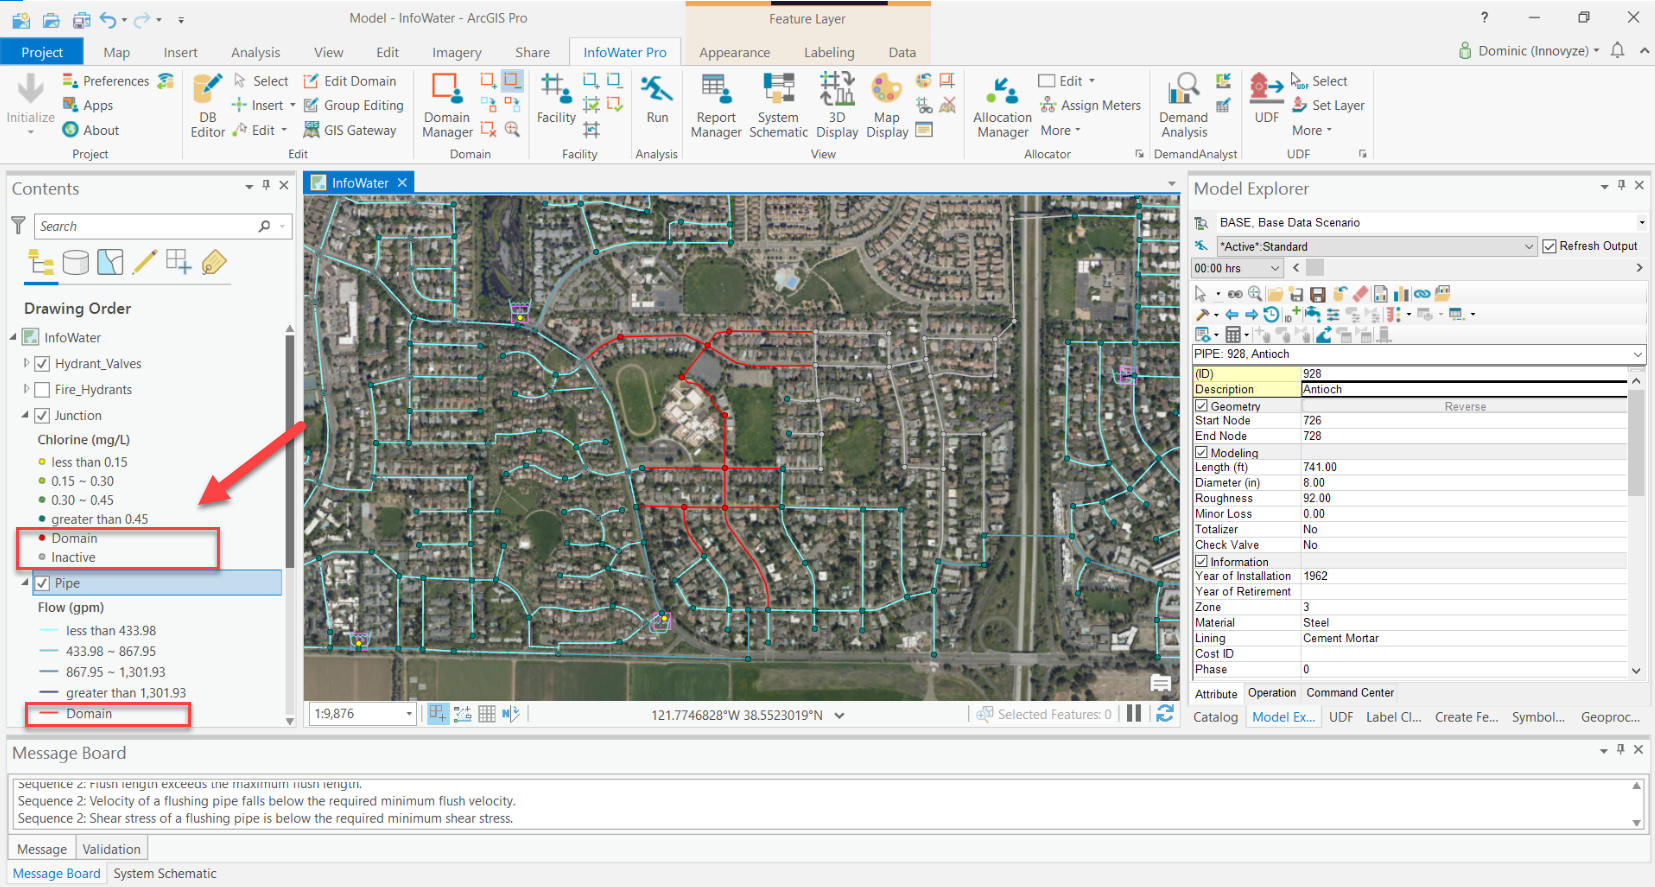
Improvements to Map Display for InfoWater Pro 2.5, Update 2
Two fields were added:
Domain - The red line in the map rendering represents the active domain elements for junctions as shown below.
Inactive - No lines represent inactive facilities elements that are not in use or disabled as you see below in the screenshot.

Units were added to each data field in the Map Display dialog box as shown below in this screenshot.
