This menu controls which components are visible, and therefore editable, in the graph view of the Graph Editor. This is useful for controlling the amount of information displayed in the graph view, as well as specifying which of the animation curve components are available for editing.
When framing the desired range, the Graph Editor may scale the area in the graph view horizontally and vertically to display the desired range.
- Undo/Redo View Change
- Reverts the Graph view.
- Clip Time
-
Clip Time lets you view the clip animation curves at their position and scale in the Trax Editor.
- Frame
-
- Frame All
-
Adjusts the graph view to fit all animation curves in the window.
- Frame Selection
-
Adjusts graph view to fit selected animation curves or curve segments in the window.
- Frame Playback Range
-
Adjusts the graph view to fit the playback range in the window.
- Center Current Time
-
If you change the view in the Graph Editor and want to shift the view so the current time is in the middle of the editor, select Center Current Time from the View menu.
- Auto Frame
-
Automatically adjusts the graph view to fit the display of the animation curves associated with a selected object or objects in the y (or value) axis.
Auto Frame is active by default. To change this default, disable Auto Frame in the Graph Editor section of the Animation (Settings) Preferences.
- Auto Frame Time
- Adjusts the graph view to automatically fit the display in the x (or time) axis. This option is only available when the Auto Frame option (above) is also active so that both x- and y- axes are framed.
-
Auto Frame Time is disabled by default. To change this default, enable Auto frame both axes in the Graph Editor section of the Animation (Settings) Preferences.
- Show Results
-
When types of animation that do not create animation curves (such as motion paths and Expressions) are part of your animation, you can use Show Results to see a graphic representation of the behavior of these animation types.Note:
To edit these types of animation, you must transform them into animation curves by performing a Bake Channel.
-
Any numeric attribute can drive Show Results. This is useful for looking at animations driven by anything other than a single animation curve. Select Show Results >
 to open and set the
Show Results Options.
to open and set the
Show Results Options.
- Click
View > Show Results > to view the Show Results options.
- Show Buffer Curves
-
Turning this on causes the graph view to display the original shape of edited curves. Selecting the checkbox at the end will display the Show Buffer Curve Options window.
Customize the default Buffer Curve and Buffer Curve key colors in the Color Settings.
- Click
View > Show Buffer Curves > to view the
Show Buffer Curves options.
- Show Play Range Shades
-
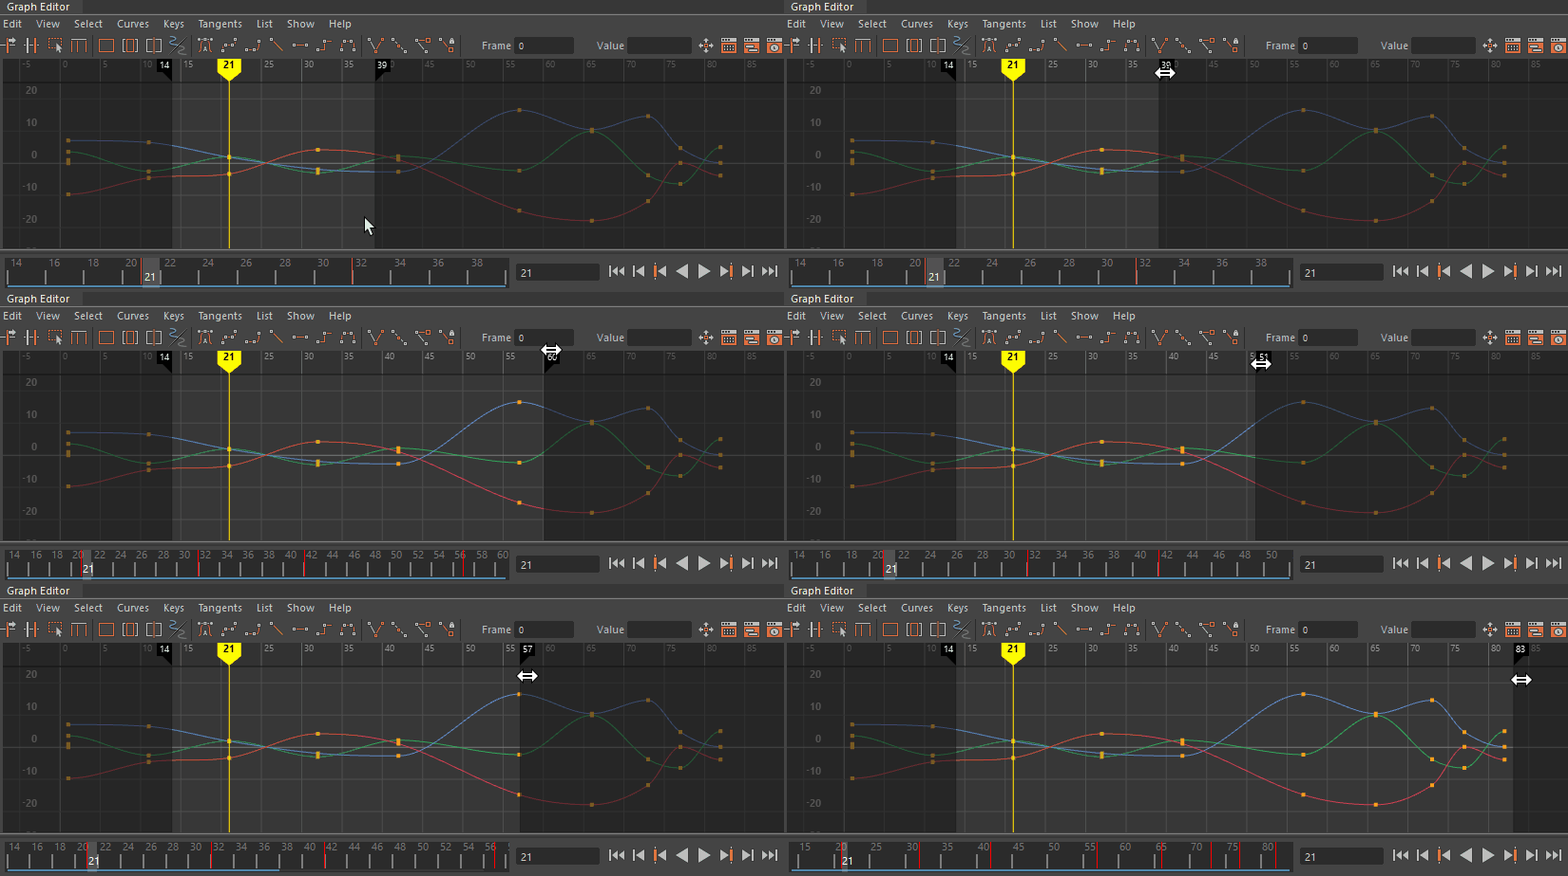
Turn this on to display the Play Range Shades in the Graph Editor.
-
Tip: You can change the color and opacity of the Graph Editor Play Range Shade in the Color Settings . See also Graph Editor Colors.See Graph Editor Play Range Shades in the Graph Editor Graph view topic for more.
- Lock Play Range Shades
- Turn this on so the Graph Editor Play Range Shades cannot be dragged. This prevents you from accidentally moving the Play Range Shades when moving the Current Time Marker to scrub the time. You can still change the Playback range with the Range slider when this setting is active, but you cannot drag the Play Range Shades in the Graph Editor.
- This setting is off by default.
- Highlight Affected Curves
-
Highlights the curve segment that is affected by the selected key/tangent. When selecting a key or tangent, the part of the curve affected by the selected key/tangent is highlighted in white.
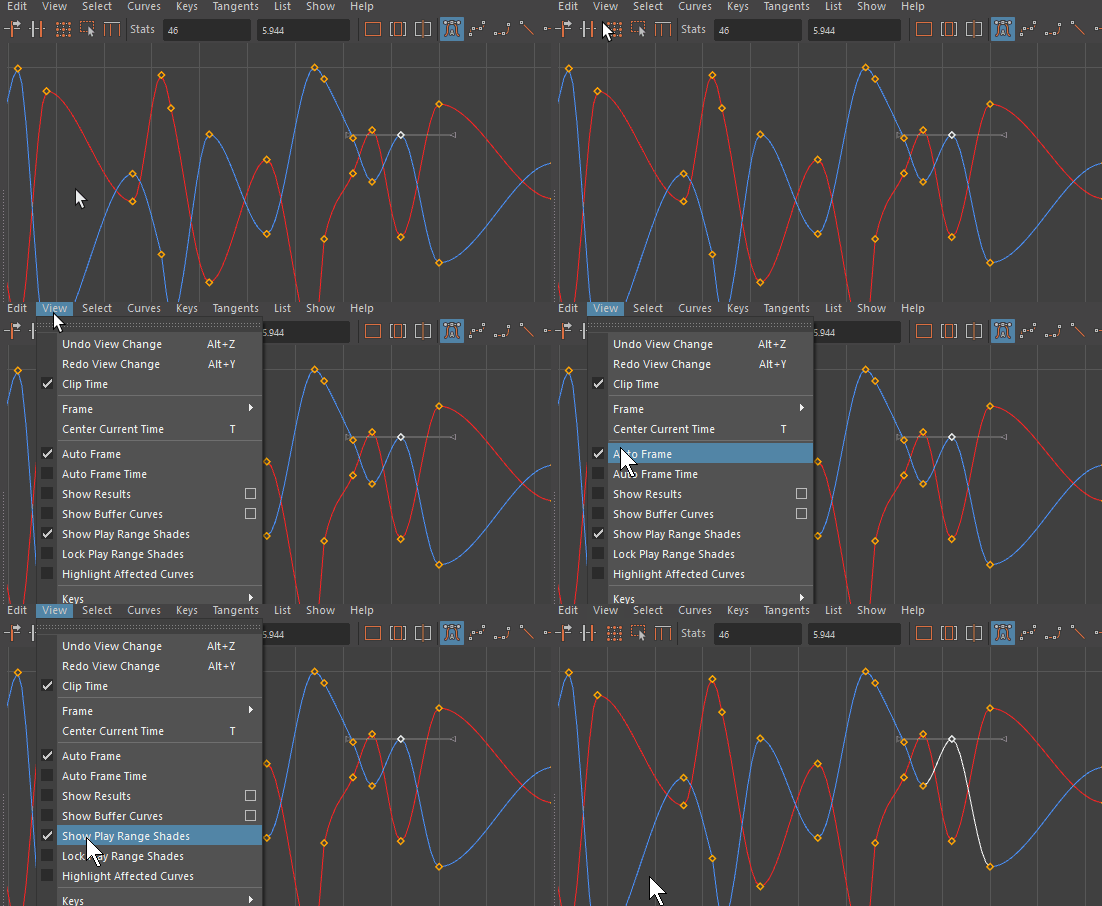
- If you:
- Select a key: the affected curve highlights each side of the key
- Select multiple keys: the entire range of the curve affected by the selection is highlighted
- Select a tangent: the segment of the curve affected by the selected tangent (on the selected side) is highlighted
- Select multiple tangents: highlights only parts affected by the selected tangents
- This setting is off by default.
- Show Pins
- This option toggles the visibility of pins in the Graph Editor outliner. The setting is enabled by default.
- Show Lock/Mute Buttons
- Shows Lock and Mute buttons in the Graph Editor outliner when you move the mouse pointer over a channel row. This option is on by default.
- When Show Lock/Mute Buttons is off, the Lock and Mute buttons do not appear on hover. You can still lock or mute channels from the Curves menu.
- If a channel is already locked or muted, the corresponding button remains visible on that channel row. Click the button to toggle the locked or muted state.
- Keys
-
Lets you set the viewable status of keys.
-
In order to operate on a component of an animation curve, you must make it viewable by loading it into the Graph Editor. By default, objects selected in a scene view are automatically loaded in the Graph Editor. Keys are represented in the graph view as orange squares, and when selected, they are highlighted white.
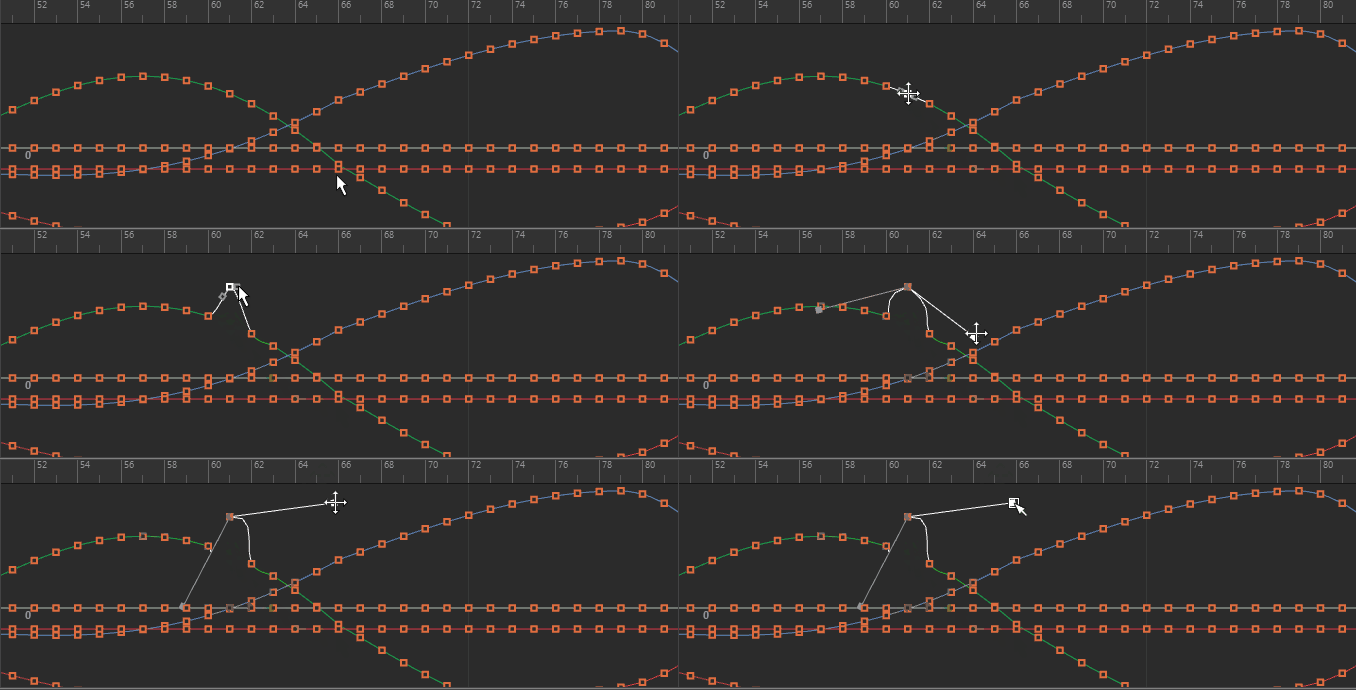
Customize the default key color in the Preferences menu Color Settings.
-
- Always
-
Sets keys to be visible at all times in the graph view of the Graph Editor.
- Never
-
Hides keys in the graph view. Because keys are no longer available for picking, you can no longer edit them.
- Active Only
-
Sets keys to be available only when you select the curve they are associated with.
- Tangents
-
Lets you set the viewable status of tangents. (In order to operate on a component of a tangent, you must make it available by being designated as viewable.)
-
Tangents are represented in the graph view as handles tangential to the curve segment of the animation curve. When selected, they are highlighted green.Note: If Unify Tangents is on for a curve segment, the handles on both sides of the key will be adjusted uniformly when you edit the selected handle. If Break Tangent is in effect, each tangent handle operates independently of the other.
Customize the default tangent color in the Preferences menu Color Settings.
-
- Always
-
Setting the viewable status of tangents to Always results in tangents being visible at all times in the graph view of the Graph Editor.Note:
If you wish to operate on tangents and you’ve disabled curves and keys in the Select menu of the Graph Editor, set the visibility of tangents to Always so they are available for selection.
- Never
-
Setting the viewable status of tangents to Never hides tangents in the graph view. Because tangents are no longer available for selection, you can no longer edit them.
- On Active Keys
-
When the viewable status of tangents is set to On Active Keys, tangents are available only when you select their associated curve or curve segment.
- Infinity
-
Infinity turns on or off the display of the animation curve extrapolated outside the first and last keys of the curve.
-
The curves before the first key and after the last key will be constant by default.Note: This option is on by default as of Maya Creative 2025.3. In previous versions, the Infinity option was off by default.
- Curve Name
- Lets you show/hide the name of the curve in the Graph view.
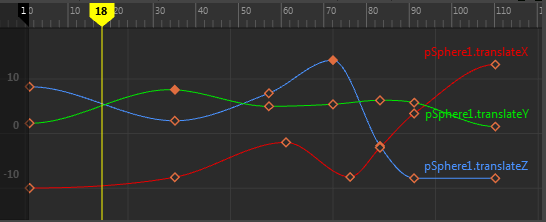
Curve names displayed
-
- Always
- Curve names always display.
- Never
- Curve names always hidden.
- Active Only
- Curve names show when curve is selected.
- Absolute View
-
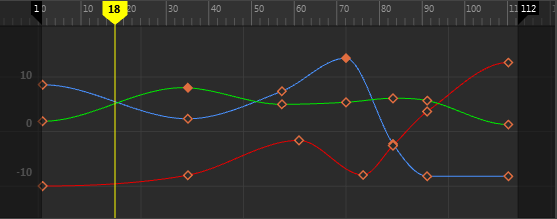
- When on, the graph view shows all key values relative to 0.
- Press
1 to activate
Absolute View.
Absolute View is the default view.
Note: Value lines are shown only in Absolute View. No values are shown in Normalized or Stacked View. See the Guide Lines section in Animation (Settings) preferences for Value Lines settings.
- Stacked View
-
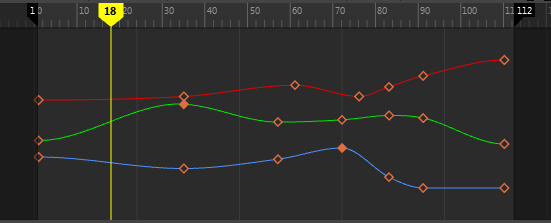
-
Note: Formerly known as Stacked Curves in Maya's Legacy Graph editor. In an effort to simplify the Stacked View, there is no coloring of the "swim lanes", fewer vertical (time) grid lines, and time values are displayed at the top of the graph.
- Press 2 to activate Stacked View.
-
When on, the graph view displays individual curves in a stack, rather than displaying all curves overlapping. When Stacked View is active, each curve displays with its own value axis, normalized between 1 and -1 by default.
Attention:When using the Scale Keys Tool or the Lattice Deformer Keys Tool with the Stacked View active, you can only modify the time value.
- You can modify the horizontal lane spacing in the Graph Editor settings in the Animation (Settings) preferences.
- Normalized View
-
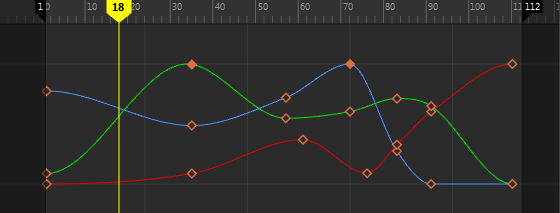 Note: Known as Display Normalized in the Graph editor.
 - Press 3 to activate Normalized View.
-
When on, this option scales down large key values or scales up small key values to fit within a -1 to 1 range. When animation curves are normalized, they are adjusted to fit within the range of normalization.
-
Curve normalization is useful when you want to view, compare, or edit animation curves that are related (such as rotation and translation curves), but have drastically different ranges. For example, with curve normalization you can compare all the translation and rotation animation curves for an object.
-
When you turn Display Normalized off, the curves revert to a non-normalized state, back to their original ranges.
Note:Animation curves that are normalized appear thicker than other curves in the Graph Editor.
Limitations: Curve normalization does not work with the following types of curves:
- Rotation curves that use quaternion rotation interpolation
- Referenced animation curves
- Locked animation curves.
- Key View
-
Lets you switch between the default
Detailed Key View (A) and
Simplified Key View (B)
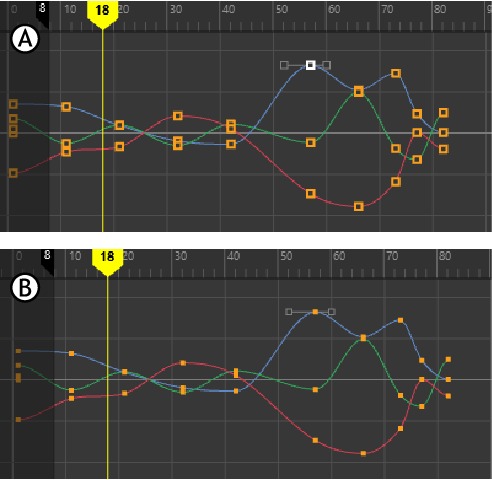
Key View: A Detailed, and B simplified
-
- Detailed key view
- The Graph Editor default view, Detailed key view, gives you visual cues about keys and tangents, such as showing filled or hollow keys that show whether a key has been edited or is automatic or identifying the type of curve. This feedback provides a quick way to identify the state of the animation you're working with.
- Simplified key view
- Simplified key view contains less visual information on the keys.
- If you want to simplify your view to show only the key you're working on, or the curves without keys, see Keys, above, and change the setting to Active.
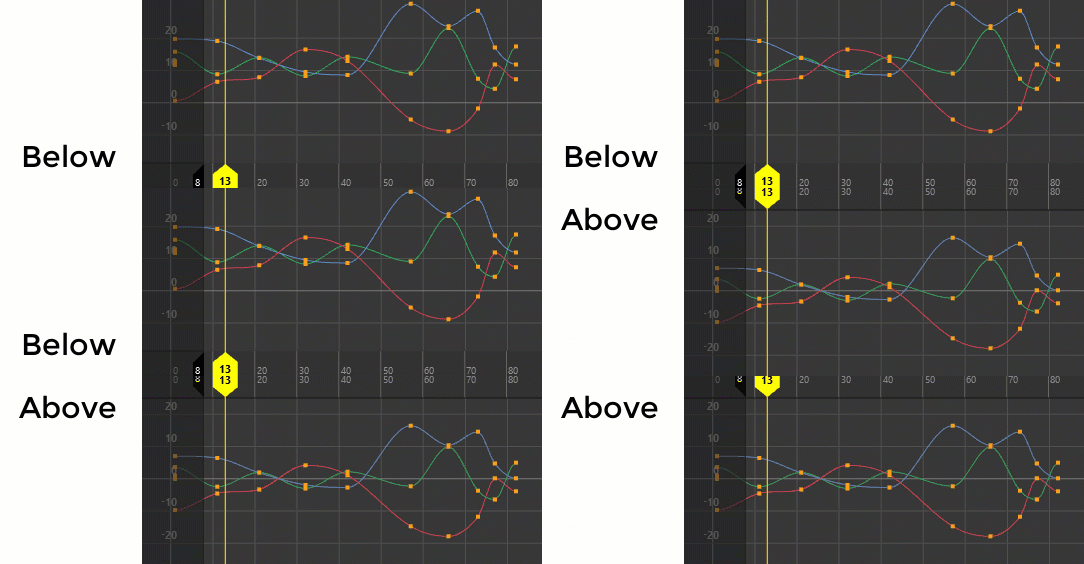
- Time ruler Placement
-
Lets you change the position of the Graph Editor Time ruler so that you can align it with the Time Slider. Choose between Top or Bottom.
- Renormalize
-
Available only when Display Normalized is on. Select this option to renormalize the curves displayed in the graph view.
Note:Curves are automatically renormalized when you turn on Display Normalized or the active curve list changes.
-
You can also quickly renormalize curves by selecting the Renormalize icon
 in the
Graph Editor toolbar.
in the
Graph Editor toolbar.
- Themes
- Lets you select from a variety of preset themes that change a selection of Graph Editor color settings and view settings at once. For more information on each theme, see Graph Editor Themes and Edit and export a Graph Editor theme.
- Simple Toolbar
-

Simple Toolbar lets you toggle between the default (A) and Simple (B) toolbar.
Activate this option to switch between the default Graph Editor toolbar with a full set of curve editing and display options, to a more streamlined version of the toolbar with only select editing and display options.
- Channel Sets
- When enabled, Channel Sets appear in the Graph Editor Outliner, as they are hidden by default.