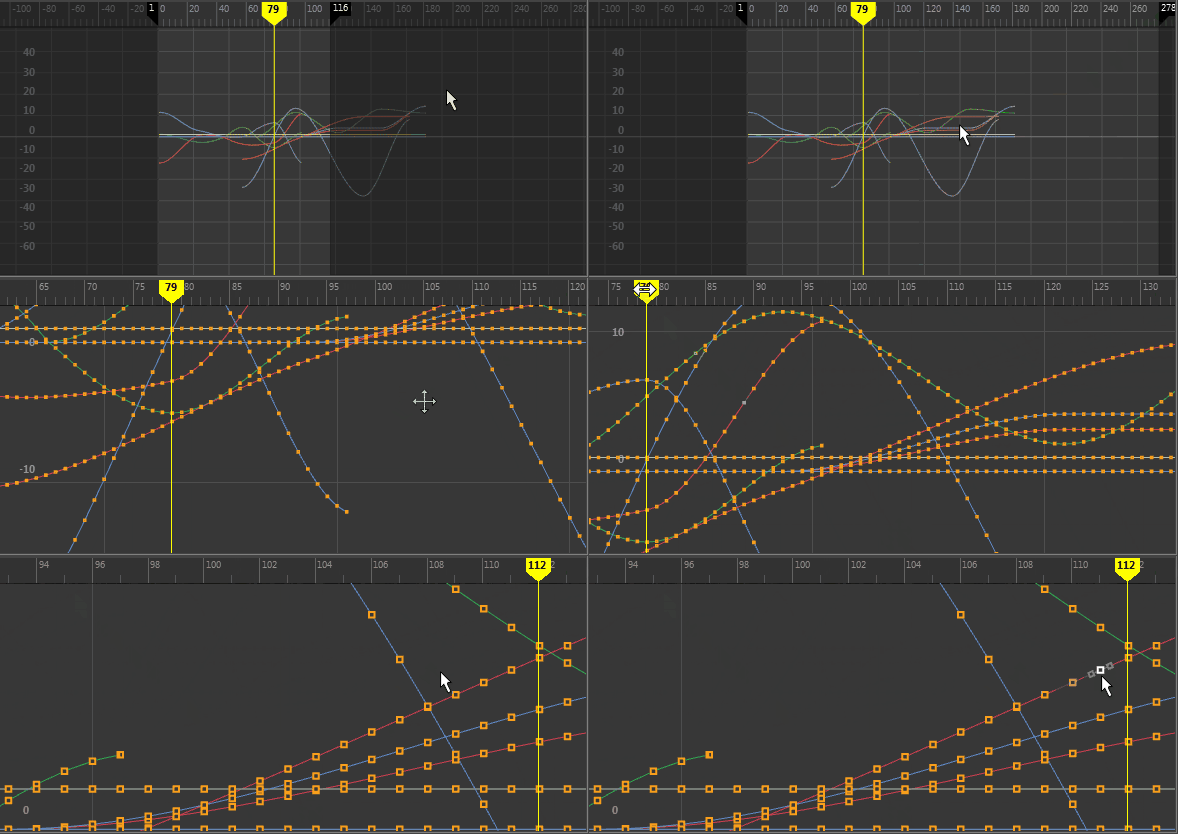
The Graph View is the area where the keys and curves are shown in the Graph Editor. See Graph Editor Interface Overview for where to find the Graph View in the Graph Editor.

The graph view of the Graph Editor displays animation curve segments, keys, and key tangents.
Right-click anywhere in the Graph Editor to open the pop-up menu containing the Graph Editor menu bar items.
In addition to the Graph Editor tools in the toolbar, you can use the Select Tool, Move Tool, and Scale Tool to manipulate keys in the graph view of the Graph Editor.
Graph Editor Time ruler

The Time ruler is the ruler that runs along the Graph Editor. It is where you can drag the Time Marker to set a key at a specific location.
You can change the color of the Time ruler background, Time Label (the numbers), as well as Time Ruler ticks in the Color settings.
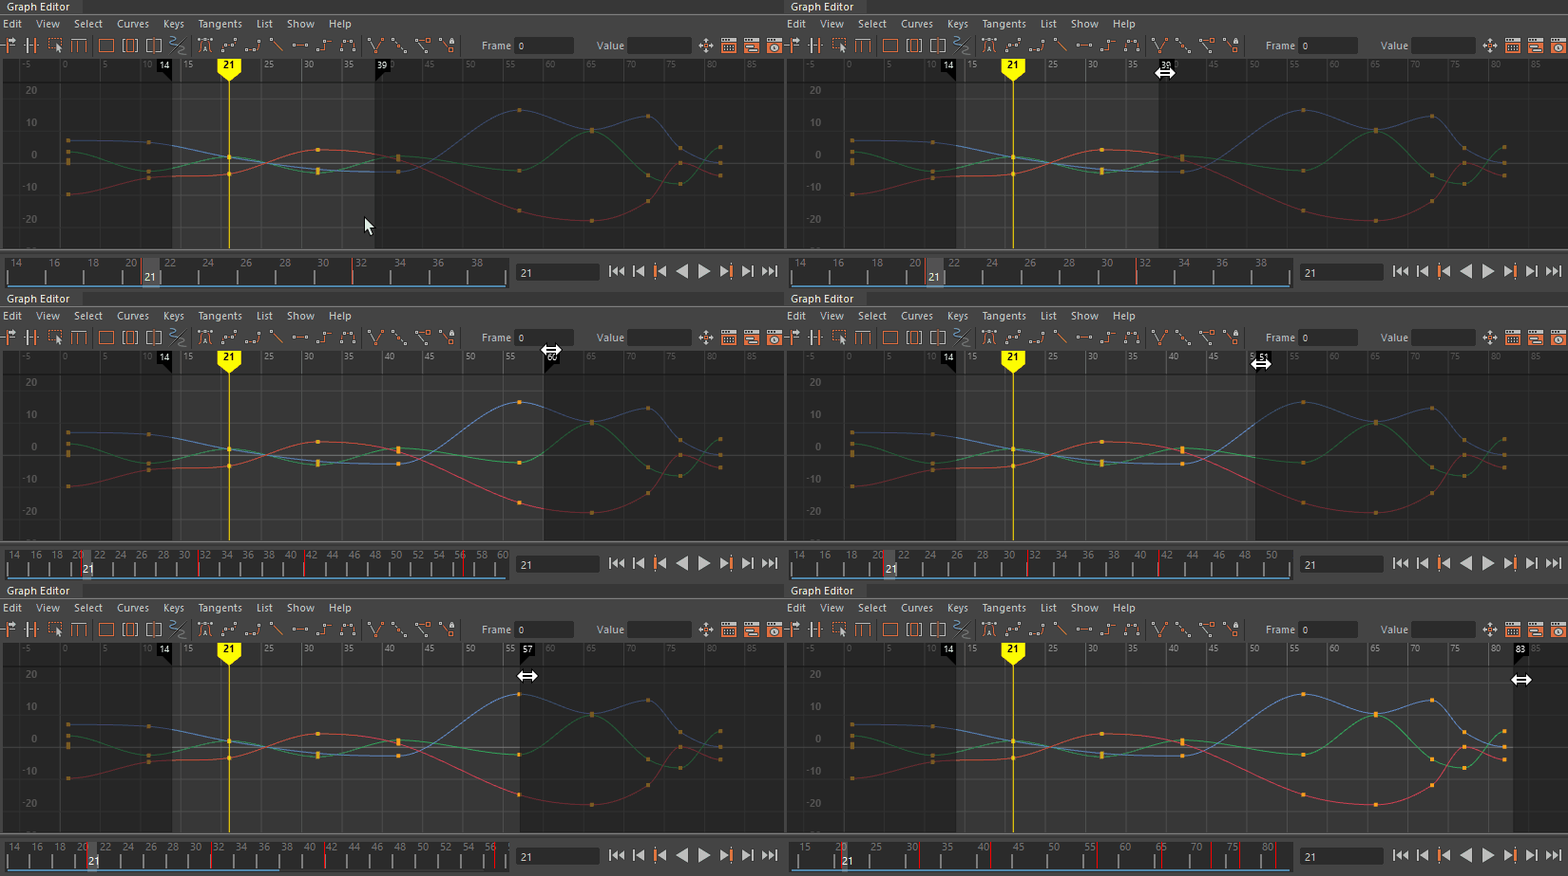
Graph Editor Play Range Shade

There are settings to hide and lock the Graph Editor Play Range Shade in the Graph Editor View menu.
Graph Editor Zoom

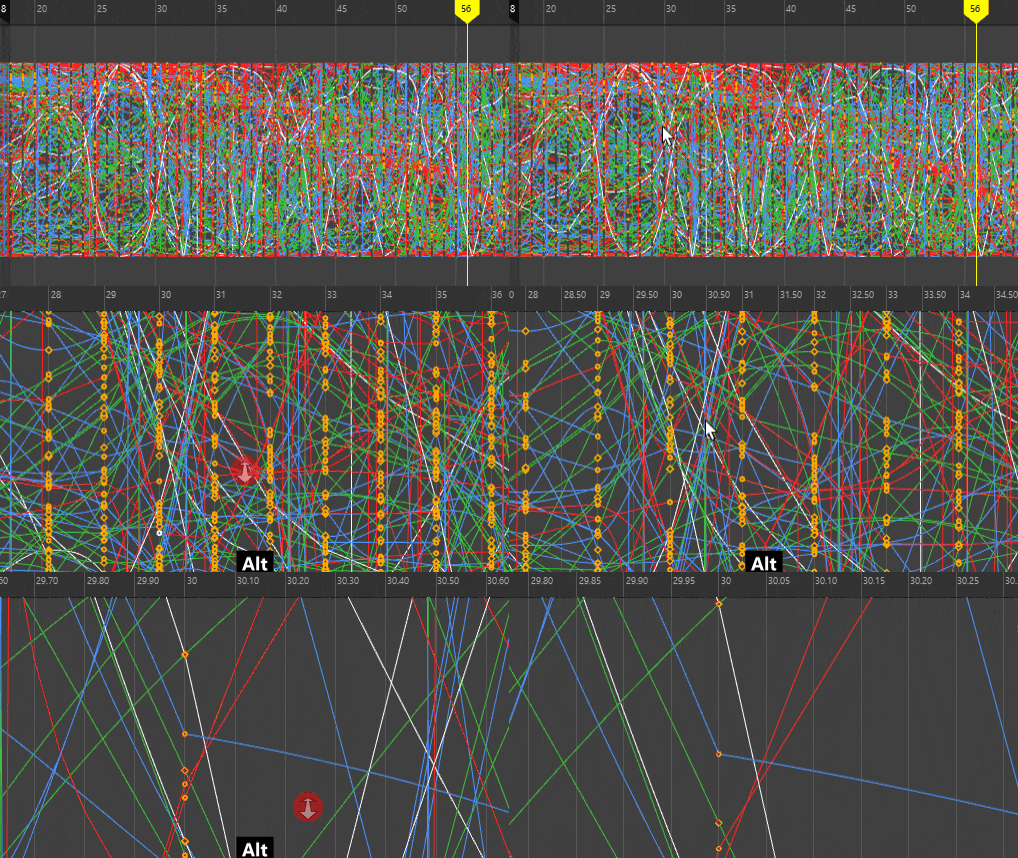
Alt-drag to zoom in the Graph Editor
Zooming in the Graph Editor is centered on the cursor position by default. You can change the zoom default to be based on the entire animation in the Graph Editor section of the Animation Preferences. You can also use the Key Size options to choose how keys are visible in the Animation Preferences.
Select Tool
Use the Select Tool to select curves, segments, tangents, and keys in the graph view.
Sweep with the mouse button down to select the contents of an area. You can click an animation curve, tangent handle, or key point to select the individual item.
Move Keys Tool
Use the Move Keys Tool to select and manipulate components of the graph view.
The Move Tool’s Move Key options are only available when the Graph Editor is active.
See Move Keys (in the Graph Editor Edit menu).