Getting Started with AMP
Note: AMP cannot be built with Win32.
To start using the AMP profiler, run the GFxAmpClient.exe executable that is located in Bin/AMP under the main Scaleform installation directory. The application starts, and the connection dialog appears.
A connection dialog appears automatically when the client starts up. It prompts the user to either select from a list of discovered AMP servers, or manually type the IP address and port to connect. Select the second approach if the AMP server of interest is not yet running, as would be the case if there is a need to profile an application as it is starting up.
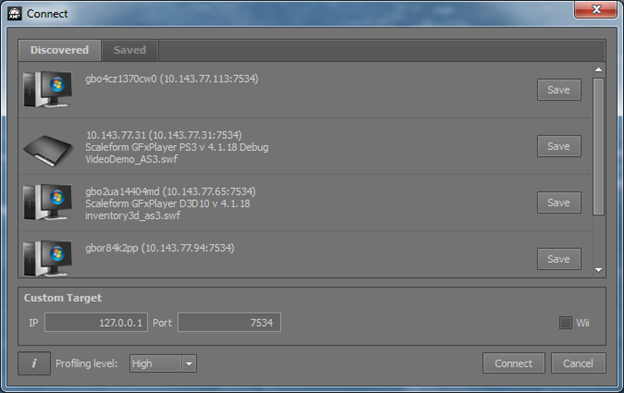
Figure 2 : AMP connection dialog
The Connection item under the File menu can be used to bring up the connection dialog at any time. Each AMP server in the discovered list has a distinct icon identifying its platform (PC, Xbox360, PS3, etc). Next to the icon is the title of the application, the IP address and port where the server is listening, and the Flash content currently being played. If some of this information is missing, it is because the corresponding AMP server is not sending it. A description of how to add full AMP support to any Scaleform application, including broadcasting the application and content information, is found later in this document. A connection is established either by double-clicking a discovered server, or by selecting a server and clicking the “Connect” button.
From the connection dialog it is possible to choose the profiling level and detailed memory reporting on connection, so that these are guaranteed to be set immediately on connection. This is especially important if the startup of a Scaleform application is being profiled.
Please note that connection to a Wii development kit (NDEV) does not use the above server discovery method. Instead, the Wii is physically connected to a PC using the USB interface (COM port) built into the NDEV. Connect to a Wii AMP server from the connection dialog by specifying “wii” in the IP address field.
Once a connection has been established, profiling information begins to flow into the client, and the graphs start getting populated. The top graph shows how much CPU time is spent per frame rendering Scaleform (Display), executing ActionScript (Advance), and in Direct Access API (User).

Figure 3: CPU Graph
If the CPU graph is not of interest at some point during the analysis, it may be minimized or resized so that more room is available for other UI elements. If one of the graphed quantities is not of interest, it may be removed by clicking on the icon next to its legend.
Related to the CPU graph, are the CPU Summary, Functions, and ActionScript tabs at the bottom of the profiler. The CPU Summary tab shows the graph information in more detail, the Functions tab shows the call graph for the selected frame, and the ActionScript tab shows a non-hierarchical view of all script functions called during the selected frame.
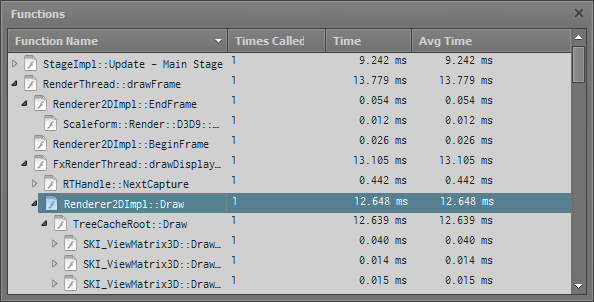
Figure 4 : Functions tab
By examining the CPU detail tabs for a frame with a spike in the CPU graphs, the cause of script performance bottlenecks may be identified. On the other hand, rendering performance bottlenecks are more easily found by examining the rendering graph.
The rendering graph shows number of draw primitives, number of triangles, number of lines, number of masks used, number of strokes, number of gradient fills, number of glyphs in the mesh cache, and number of font cache allocations that occurred during rendering for the selected frame. The Best Practices Guide explains in detail why minimizing the above quantities is important for performance.

Figure 5: Rendering Graph
Related to the rendering graph, is the Render Summary tab at the bottom of the application.
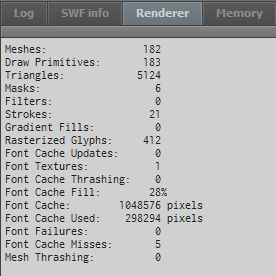
Figure 6: Rendering Summary
The third and fourth graphs from the top show Scaleform system and graphics memory usage, respectively:
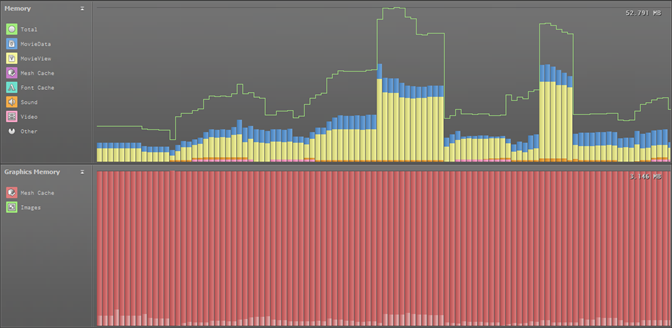
Figure 7: Memory graphs
- Total: The total memory claimed by Scaleform (footprint). The total memory is drawn as a line graph, and includes all the categories listed below, as well as unused memory due to overhead, granularity in requested allocations, and fragmentation. Note that the total memory is greater than the sum of the used memory categories due to unused memory not being displayed in any category.
- MovieData: Memory occupied by all loaded SWF or GFX files. Object data, embedded fonts, and timeline animations affect this number.
- MovieView: Runtime memory occupied by GFx::Movie instances, allocated for timeline animation support, on-screen objects, and ActionScript.
- Mesh Cache: Memory occupied for the cached shape mesh data, generated by the vector tesselator and edge anti-aliasing. The mesh cache memory may be allocated from system or graphics memory, depending on the platform. The memory actually used is shown in a darker shade, so that the user may easily identify if a smaller mesh cache could be set, thereby saving memory.
- Font Cache: Memory used by the font cache.
- Sound: Memory used for embedded sound data. It is affected by the number, length, or quality of embedded sound samples.
- Video: Memory used for video memory playback buffers. These buffers are allocated when videos start, and released when they stop.
- Other: Memory that is in use by Scaleform, but not part of the above categories. For a more detailed breakdown of memory categories, please toggle detailed memory reports, as described below
- Images: Graphics memory used for images (textures). See the Memory System Overview document for more details on the memory system and how to configure, optimize, and manage it.
The Memory tab shows the above memory categories in more detail. All values in the memory tabs are in the same units (bytes, kilobytes, or megabytes), as specified in the memory units selection, under the view menu. Please note that “Used Space” is memory in active use by GFx. “Unused Space” is memory that has been reserved by GFx but is not being used, mostly due to fragmentation. Debug Data denotes memory used internally by GFx for tracking memory and performance statistics.
When profiling in full memory report mode, which is toggled by the “i” button on the AMP toolbar, the memory report becomes more detailed, showing a breakdown by heap, by file, and by purpose. The debug version of the Scaleform libraries separates heap allocations into memory categories, from which the user can obtain a better understanding of how Scaleform is using the memory that is being consumed. The memory categories reported are as follows:
- Renderer: Memory allocated by the Scaleform rendering engine. This category is further subdivided into the following subcategories:
- Buffers: Memory allocated for the mesh staging buffer, which acts as a short-term cache that stores generated meshes before they are instanced and copied into the vertex and index buffers.
- RenderBatch: Memory allocated for collections of entities such as meshes, primitives, or rendering commands associated with nodes in the rendering tree that are to be drawn together.
- Primitive: Memory used to hold collections of vertices that are to be drawn together.
- Fill: Memory used to store and manage data describing a hardware fill.
- Mesh: Memory allocated for the mesh cache. The mesh cache is used to feed to the renderer with vertex and index buffer data.
- MeshBatch: Memory allocated for the individual chunks of data cached in vertex and index buffers of the Mesh Cache.
- Context: Memory consumed by the rendering support system that manages the lifetime of the rendering trees. The context maintains multiple logically independent snapshots of the rendering tree so that threads can work on the rendering data without interfering with each other.
- NodeData: Memory for frame-state information, such as the current matrix or effects applied to the objects being rendered.
- TreeCache: Memory allocated for the renderer’s scene graph, which is a tree structure of objects that are being rendered.
- TextureManager: Memory allocated to managing texture images. The actual image data are normally not stored in system memory, and are not, therefore, part of this memory category.
- MatrixPool: Memory consumed by a pool of matrices maintained by the renderer.
- MatrixPoolHandles: Memory consumed by allocation of matrix handles.
- Text: Memory allocated for text management and rendering, such as formatting information, style and color information, html parsing, rich text data, and line buffers.
- Font: Memory related to font rendering, such as glyph rasterization and font cache storage.
- MovieDef: Memory allocated for the immutable data representing the template of a movie element. It consists of the following subcategories:
- CharDefs: Memory used for character definitions, such as buttons and text.
- ShapeData: Memory used for shape definitions.
- Tags: Memory used for ActionScript tags
- Fonts: Memory used for font resources.
- Sounds: Memory used for sound data.
- ASBinaryData: Memory consumed by the ActionScript buffer data.
- MD_Other: Other MovieDef data, not included in the above categories.
- MovieView: Memory allocated for timeline animation support, on-screen objects, and ActionScript. It is further divided into the following subcategories:
- MovieClip: Memory used for on-screen animated objects.
- ActionScript: Memory consumed by ActionScript code and data.
- ASString: Memory consumed by ActionScript strings
- Text: Memory consumed for text-related display objects.
- XML: Memory consumed for XML objects.
- MV_Other: Other Movie View memory that does not fit in the above categories.
- VM: Memory allocated for the ActionScript virtual machine. This category is further broken down as follows:
- AS3 VM: Memory consumed by the ActionScript 3 virtual machine, but not part of the following subcategories.
- CallFrame: Memory allocated for each entry in the call stack during ActionScript execution.
- VTable: Memory consumed by the ActionScript virtual table
- SlotInfo: Memory used for structures that describe ActionScript Class members. Each ClassTraits and InstanceTraits contain SlotInfo structures in order to describe the Class or Instance memory layout. See below for more information on ClassTraits and InstanceTraits.
- SlotInfoHash: Memory used by hash tables that speed up property lookup for ActionScript.
- ClassTraits: Memory allocated to hold the memory layout of ActionScript Classes
- Class: Memory allocated to hold static members of ActionScript objects
- InstanceTraits: Memory allocated to hold the non-static memory layout of ActionScript Objects.
- Instance: Memory allocated to hold instance variables and methods of ActionScript objects.
- AbcFile: Memory allocated for data structures representing byte code and its corresponding data.
- AbcConstPool: Memory used for storing constants, such as numbers, strings, namespaces, and multinames. This is just byte code, so it is part of AbcFile, above.
- VMAbcFile: Memory holding an internal data structure that stores the optimized byte code generated from the AbcFiles, dependencies among files, and other information.
- Tracer: Memory allocated for code optimization.
- IME: Memory consumed for Input Method Editor (IME) support.
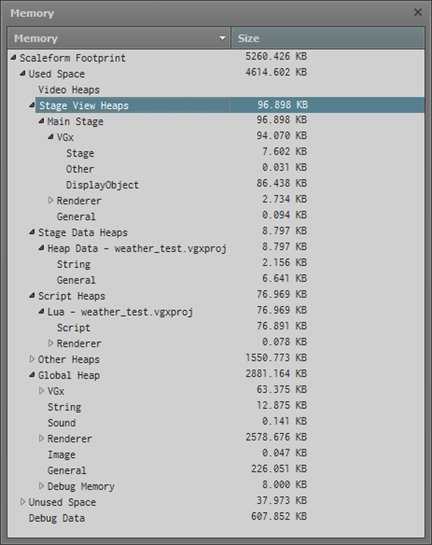
Figure 8: Memory
Expanding each category reveals subcategories or memory heaps responsible for direct allocations in that category, if any. Drilling down in this manner, it is possible to gain a deeper understanding of Scaleform memory use in any particular frame.
The Images tab is also related to memory profiling, as it displays the images loaded in the selected frame(s), along with their sizes.
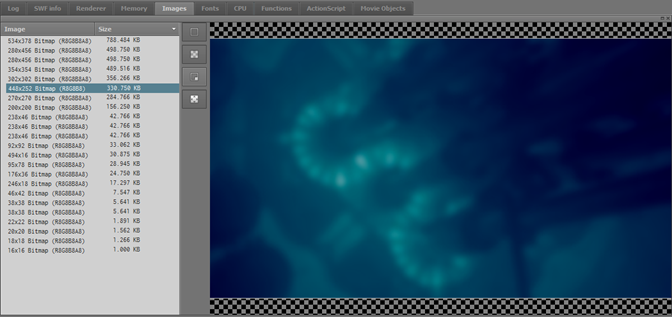
Figure 9: Images memory tab
Use this tab to quickly check whether a large image is present that increases the memory consumption of the target Scaleform application. Clicking on an item in the image list displays a thumbnail of that image in the preview pane. Note that the image data are not sent as part of the profiling information, but are sent upon request. Therefore, it is possible that no image is displayed if that image has already been unloaded by the connected Scaleform application.
The final tab related to memory profiling is the Fonts tab, which displays font information for the selected frame(s).

Figure 10: Fonts memory tab Use this tab to examine the number of embedded glyphs for each font type, per SWF file.
Embedded fonts can consume a significant amount of memory, which shows up in AMP by increased sizes of the MovieData heap and the CharDefs category. These may be examined in the Heaps and Memory tabs, respectively. Font memory may be reduced by sharing fonts over several SWF files.
AMP may be used to remotely trigger a special rendering mode that highlights potential problem areas in the profiled application. To toggle this rendering mode, click on the appropriate button located on the application control toolbar.
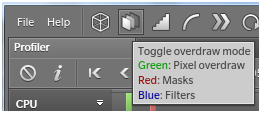
Figure 11: Toggle Button
Once this mode is toggled, all objects are rendered in green. Green indicates pixel overdraw (16 layers for full brightness), masks are red, and filters are blue (8 layers of masks or filters for full brightness). These colors blend together, so a bright yellow area is high overdraw with nested masks.
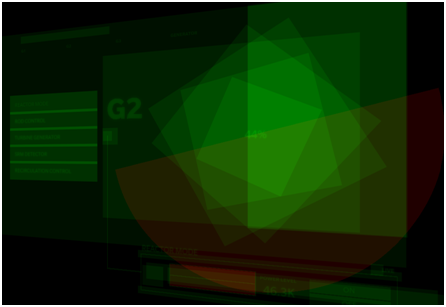
Figure 12: Rendering mode for Overdraw profiling
Overdraw, masks, and filters all affect performance, and should be minimized whenever possible.
Another special rendering mode that AMP supports is batch profiling. To toggle this rendering mode, click on the appropriate button located on the application control toolbar.
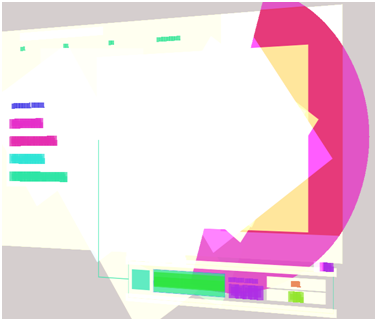
Figure 13: Batch profiling mode
Once this mode is toggled, each rendering batch is rendered in a different color. Best performance is achieved by minimizing the number of batches, whenever possible.