AMP User Guide
AMP™ is the Scaleform® remote profiling system, capable of monitoring CPU usage, graphics rendering, and memory consumption of a Scaleform application. Real-time graphs provide a method of quickly identifying memory and performance bottlenecks, and per-frame statistics allow an in-depth analysis and determination of the causes. AMP can also help find script problem areas, using its per-frame ActionScript function and source code timings.
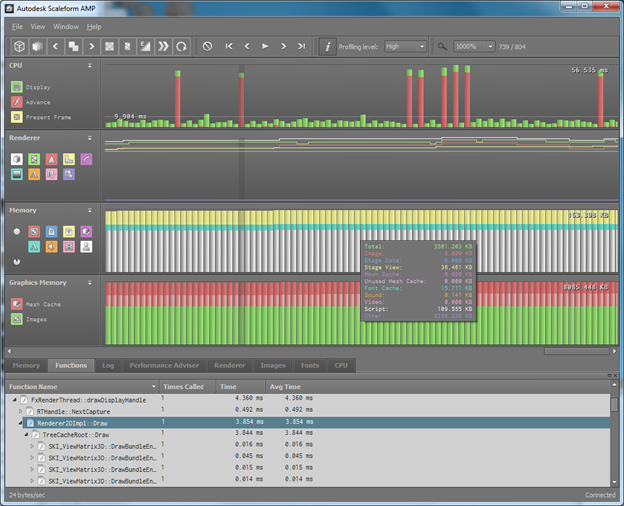
Figure 1: Scaleform AMP
Every Scaleform application can act as an AMP server, which means that it listens for incoming connection requests by the profiler, gathers information every frame, and sends it to the profiler over the network. The profiler acts as an AMP client, which means that it connects to a specific AMP server, processes the information sent from the server every frame, and sends requests to control the profiled application.
AMP is available with Scaleform 3.2 and higher versions.
A Scaleform application being profiled (the AMP server) sends a certain amount of information over the network to the profiler. Depending on the level of function profiling, each ActionScript function and some important C++ functions may be timed. If per-line source code profiling is enabled in ActionScript 2, each ActionScript bytecode execution is timed (ActionScript 3 source code profiling does not require timing each execution). In addition, rendering statistics, detailed memory heap and image information, flash file information, and ActionScript markers are recorded. Note that this extra work per frame can slow down the application and increase its memory consumption, especially if per-line timings are enabled.
In order to keep AMP from interfering with the application being profiled, all AMP server information is kept on a separate memory heap. If the size of this heap exceeds a pre-set limit, the application is paused until the pending frame information is sent over the network and subsequently deleted. Scaleform Shipping builds do not act as AMP servers, and AMP support may be easily disabled for any build within an application, if so desired.
Performance statistics on the server are maintained per Movie. This allows users to easily identify problem spots in the case where there are several views associated with a particular SWF file. It also allows AMP to produce meaningful call graphs for ActionScript execution of multiple Movies on separate threads.
In addition to reporting memory and statistics to the client, the server can be controlled by the AMP client in several ways to assist profiling. For example, the profiler can send requests for wireframe mode rendering, for pausing, fast-forwarding, or restarting the flash movie, for toggling the anti-aliasing and stroke modes, for changing the localization fonts, and for changing the vector graphics’ curve tolerance. Furthermore, the client can toggle special AMP rendering modes to show display performance bottlenecks, such as mask, filter, and pixel overdraw highlighting.
While all the above functionality has been implemented in Scaleform Player, some of it requires application-specific implementation, and may be performed as part of a Scaleform integration. To graciously handle the case where some of these capabilities have not been implemented in a Scaleform application, the AMP server reports the set of supported application control functionality to the client on connection. It also reports its current state (wireframe mode, for example) to the client for visual feedback.
Finally, the AMP server has the ability to send Flash debug information over the network to the profiler, so that source code and per-line timings can be displayed if the client does not have local access to that information. In order for this transfer to occur, the SWD file (ActionScript2) or AS file (ActionScript3) should be in a location where AMP can find it.
The remote profiler (AMP client) is a stand-alone application that connects to an AMP server, receives profile information every frame, and displays this information in a user-friendly way to enable effective analysis of performance and memory bottlenecks. The AMP client has several features that allow developers to view multiple aspects of their Flash assets and identify problem areas:
- CPU graph: Shows how much time was spent per game frame in ActionScript (Advance), Scaleform rendering (Display), the Direct Access API (User), and graphics buffer swapping (PresentFrame). This graph is especially useful to identify spikes in CPU usage due to Scaleform. When a frame with a spike is selected, the cause can be identified by examining the detailed statistics for that frame. The user may select multiple frames by left-clicking on the graph and dragging the mouse until the desired range of frames has been selected. Right-clicking and dragging the graph scrolls the graph window. Each of the components of this graph may be shown or hidden by clicking on its corresponding toggle button in the legend box.
- Rendering graph: The Scaleform Best Practices Guide document identifies several rendering-related areas that may cause performance hits, such as an excessive number of draw primitives, triangles, and lines, or the presence of masks, filters, strokes, or gradient fills. Counters for each of these areas are shown in the rendering graph, so that developers can gain more insight to what is happening inside Scaleform.
- Memory graph: The memory consumption of Scaleform is tracked in the memory graph, allowing the developer to quickly monitor system memory usage by category such as rendering, images, sound, fonts, movie data, etc, and includes all loaded files.
- Graphics memory graph: Most of the Scaleform graphics memory consumption is also tracked by AMP, which reports GPU memory consumed for images and for the mesh cache.
- Log tab: Clicking on the Log tab displays the Scaleform log that has been produced by the profiled application over the course of the connection.
- Performance Adviser: This tab provides guidance on how to improve the performance of Flash content. It is a list of warnings that fire when a user-defined threshold of some content-related property has been exceeded. The performance-related properties are:
- Text Fields optimized for readability: If you use "Anti-alias for readability” for large text fields then the font cache contains separate glyph entries for each font size of each character. If a text field uses "Anti-alias for animation" then there will be only one entry, regardless of font size.
- Ratio of draw primitives to number of meshes: This is a measure of batching efficiency. In the worst case of no batching, there will be one mesh for each draw primitive (ratio of 1.0). The ratio drops when some meshes are part of the same draw primitive, which is an indication of improved batching efficiency.
- Number of draw primitives: A high number of draw primitives is an indication of a complex scene that takes longer to render.
- Number of meshes: A high number of meshes is also an indication of a complex scene.
- Number of triangles: A high number of triangles hurts both memory and performance.
- Mesh cache evictions: This is the number of times per frame that an item is removed from the cache to make room for a new entry. Ideally, this number is zero, which means that everything needed by the renderer is found in the cache.
- Number of strokes: As indicated in the “Best Practices” guide, strokes in flash content result in a performance hit.
- Number of gradient fills: As indicated in the “Best Practices” guide, gradient fills also result in a performance hit.
- Number of masks: As indicated in the “Best Practices” guide, the use of masks results in a performance hit.
- Number of filters: As indicated in the “Best Practices” guide, the use of filters results in a performance hit.
- Number of DirectAccess API calls: Too many DirectAccess API calls can result in a performance hit.
- Number of rasterized glyphs: Too many glyphs can hurt memory consumption.
- Number of font textures: Some platforms may have more than one font texture.
- Number of font texture allocations: The number of times per frame a new font texture is created. This can hurt performance.
- Font cache evictions: This is the number of times per frame a glyph is removed from the cache to make room for a new glyph. Ideally, this number is zero, which means that the font cache is large enough to hold all rasterizations.
- Font misses: This is number of times per frame glyphs are rasterized because they are not found in the font cache. This number can be high when text has not been encountered before, and this is normal. Sometimes, there may not be enough space left in the glyph cache to store additional glyphs when new text is encountered. When this happens, older glyphs have to be evicted from the cache to make space for new ones. This means that when the old text is encountered again, it will have to be re-rasterized and rendered to the cache, incurring a performance penalty. This type of font cache eviction is bad and should be optimized whenever possible.
- Unused font texture percentage: A high percentage indicates that there is space reserved for the font cache that is not being used.
- Used font cache area: Too many different font and styles can result in excessive memory consumption.
- Total font cache area: The size of all the font textures. A font cache improves performance at a memory consumption cost.
- Total Memory: The total Scaleform memory footprint.
- MovieData Memory: This is directly related to the size of the imported movie files.
- Font Memory: Font memory can be reduced by having text fields share fonts.
- MovieView Memory: The memory used for GFx::Movie, containing its timeline and instance data. MovieView memory is subject to internal garbage collection.
- ActionScript Memory: Too much ActionScript content can result in excessive memory consumption.
- Mesh Cache Memory: The mesh cache improves performance, but hurts memory consumption.
- Unused Mesh Cache Memory: Unused mesh cache hurts memory consumption without improving performance.
- Image Memory: Both system and graphics card memory used for images.
- Video Memory: This is memory used for Scaleform video, not GPU memory.
- Sound Memory: Memory used for sound.
- Number of images exceeding a certain size: The user can set the image threshold, and AMP reports the number of images that exceed that threshold.
- Text Fields optimized for readability: If you use "Anti-alias for readability” for large text fields then the font cache contains separate glyph entries for each font size of each character. If a text field uses "Anti-alias for animation" then there will be only one entry, regardless of font size.
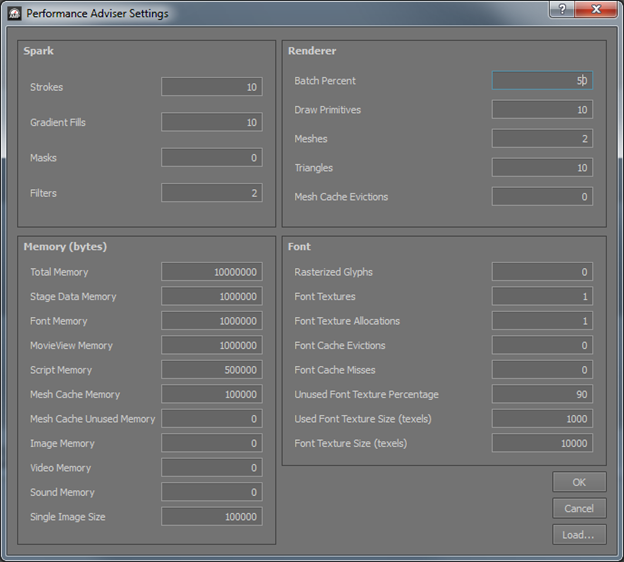
To set values for all of the above thresholds, AMP reads an XML file, called “adviser.xml” in its working directory. If it finds no such file, all thresholds are set to zero. The user can modify any threshold by clicking the Settings button on the right of the Performance Advisor tab. This brings up the settings dialog:
- SWF info tab: This tab provides some static information about the all the flash files being profiled. This information includes file name, flash version, movie dimensions, and movie frame rate.
- Renderer tab: This tab shows the same information as the graph, but in numeric form. It also includes some additional rendering statistics, such as mesh and font cache evictions, font fill rate (the area of all the glyphs as a percentage of the total area of the font cache textures), font cache failure rate (how many glyphs failed to allocate during the frame, and were replaced by vector shapes), number of font cache texture allocations during the frame, and current number of font textures.
- Memory tab: This tab allows the user to determine in detail the Scaleform footprint, how much memory claimed by Scaleform is actually in use, and how memory is allocated by purpose.
- Images tab: Shows the memory consumed by each image, along with its dimensions and format. Clicking on each item in the list displays a thumbnail of that image in the preview pane. Note that the image data are not sent as part of the profiling information, but are sent upon request. Therefore, it is possible that no image is displayed if that image has already been unloaded by Scaleform. AMP currently does not support preview for all image formats, such as DXT compressed images.
- Fonts tab: Shows the total memory consumed by the font cache, as well as the font list for each SWF. When an item in this tab is selected, an image representing the current font cache is displayed, in similar manner as for the image preview in the images tab.
- CPU tab: Breaks down the Advance, Display, and User times into sub-categories to provide a more in-depth overview of where the time was spent for the selected frame(s). If multiple frames are selected, then the values will be the average over those frames.
- Functions tab: Shows a tree control with the amount of time spent inside each function, inclusive of the functions that were called from it. When multiple frames are selected the time and number of calls are an average per game frame. ActionScript and C++ functions are mixed in the same call graph because the code path may move between the ActionScript VM and the rest of the application. Expanding each function reveals the functions that were called from that function.
- ActionScript tab: This tab shows similar information as the Functions tab, but the information is not hierarchical, C++ functions are excluded, and the time for each function excludes the time spent in other functions in the list. The tab is useful to quickly identify the most expensive script functions.
- Source pane: This window is part of the Functions and ActionScript tabs. It shows the amount of time spent in each line of the code for the selected function in the Functions tab. For AS3, per-line timings are always enabled for code that resides in AS files. For AS3 code embedded in the SWF, no source code is showm. For AS2, in order to see per-line timings, which are off by default, the “high” level of function profiling needs to be selected from the drop-down control on the toolbar. Instruction profiling in AS2 is time-consuming, and can slow down the Scaleform application being profiled, so it is best done after a problem area has already been identified. The timings shown next to each line do not add up to the amount of time reported in the function call graph in the case where the function was called by more than one other function. This is because the per-line timings are the total time spent in the function regardless of from where it was called. Also, line timings do not include the time spent inside function calls, whereas the call graph timings include time spent in called functions. In order to display source code and per-line timings, any flash debug files not found on the AMP server (SWF location) need to be in the working directory of the AMP client executable, or in the case of AS3 source files, in the same relative path to the loaded SWF.
- Movie Objects tab: The left pane shows the display object tree for each movie. The right pane shows a report about current ActionScript objects and the links between them. This report may be used to determine how objects in the selected MovieView reference each other and why they have not been garbage collected. Note that the information shown is updated only when a MovieView is selected in the list control on the left pane, and is therefore unrelated to the currently selected frame on the graphs of the profiler.
- File menu: This menu includes the following choices:
- Connection: Brings up the connection dialog, for connection to a different server.
- Disconnect: Terminates the current connection.
- Compress Net Msgs: Toggles network message compression. Turn this off to connect to an AMP server that does not support zlib compression.
- Debug Info Paths: Brings up a dialog listing all the paths in the file system where AMP searches for SWD files (for AS2) or AS files (for AS3). Paths may be added or removed using the Add and Remove buttons, respectively.
- Load Profile Frames: Loads a previously-saved profile run for reexamination. Selecting this menu item brings up a file load dialog, which is used to locate the profile data file.
- Save Profile Frames: Saves the current profile run to disk. The run can be reloaded by selecting the “Load Profile Frames” option, above. Selecting this menu item brings up a file save dialog, which is used to select the path and name of the file containing the profile data.
- Dump Memory Report: Saves the current profile frames to a file named “AmpMemReport.txt” in the working directory of AMP.
- Exit: Closes the application.
- View menu: This menu includes the following choices:
- Graph Tooltips: Selecting this menu toggles context-sensitive popup help when placing the mouse over the graphs in AMP.
- Time Units: Allows the user to select the units for reporting all time quantities, such as display and advance times. The choices are milliseconds and microseconds.
- Memory Units: Allows the user to select units for the Memory tab and the Memory graph. The choices are bytes, kilobytes, and megabytes.
- Window menu: This menu allows the user to show and hide any of the tabs (Log, SWF Info, Renderer, Memory, Images, Fonts, CPU, Functions, ActionScipt) described above. It also features a Restore UI choice, which removes any window customization the user has previously made to the AMP application.
- Help menu: This menu currently has two options: this user guide, and About, which brings up a screen with the AMP version and credits.
- Application Control toolbar: This UI element contains a series of buttons for controlling the application being profiled.
- Wireframe: Sends a request to the profiled application to render content in wireframe mode. When the application is already in wireframe mode, clicking the button takes it out of that mode.
- Overdraw mode: Sends a request to the profiled application to enter a rendering mode that highlights areas of pixel overdraw, masks, and filters. The AMP server renders areas of pixel overdraw with green (color intensity is proportional to number of overdraws), masks with red, and filters with blue. When the application is already in overdraw mode, clicking the button takes it out of that mode.
- Previous Batch: This button is enabled only when batch profiling mode is active. Clicking in sends a request to the profiled application to change the highlighted batch.
- Batch profiling mode: Sends a request to the profiled application to ender a rendering mode that draws each render batch in a different color. When the application is already in batch profiling mode, clicking the button takes it out of that mode.
- Next Batch: This button is enabled only when batch profiling mode is active. Clicking in sends a request to the profiled application to change the highlighted batch.
- Texture Density: Sends a request to the profiled application to enter a rendering mode that shows the screen-space density of texels within a primitive. Primitives that do not use textures appear in blue with low alpha. Primitives with a texel density above two texels per pixel are shown in red, and those with a texel density of zero are shown in green. The color of texel density values between zero and two is linearly interpolated (green, yellow, red).
- Blending view mode: Sends a request to the profiled application to enter a rendering mode that shows primitives that use blending. Primitives that use blending are shown in green, while primitives that not use blending are shown in red.
- Anti-aliasing: Sends a request to the profiled application to cycle through anti-aliasing modes. The three modes available are Scaleform’s edge anti-aliasing technique (EdgeAA), Hardware- full-scene anti-aliasing (HW FSAA), or no anti-aliasing (None).
- Fast-forward: Sends a request to the profiled application to play the flash content in fast-forward. This causes the SWFs to advance as fast as the rendering frames and disregard its document FPS setting. When the application is already in fast-forward mode, clicking the button takes it out of that mode.
- Restart: Sends a request to the profiled application to restart the flash content.
- Frame control toolbar: This toolbar consists of the following buttons:
- Clear: Discards the current profile run. The profile frames are discarded, thereby freeing up AMP client memory for new data.
- First Frame: Selects the first frame in the current profile run, thereby updating the information displayed on the bottom panel tabs.
- Previous Frame: Selects the previous frame from the currently-selected one, thereby updating the information displayed on the bottom panel tabs.
- Pause/Play: Sends a request to the profiled application to stop sending memory and performance data. This operation does not pause the application itself. Clicking the button again resumes the profiling.
- Next Frame: Selects the next frame from the currently-selected one, thereby updating the information displayed on the bottom panel tabs.
- Last Frame: Selects and locks onto the last frame in the current profile run. As information for new frames is received, the selection is changed to always be the last received frame, and the information displayed on the bottom panel tabs is continuously updated.
- Profiling toolbar: This element consists of a series of buttons that are used for profiling.
- Detailed Profiling (detailed memory breakdown): When this option is selected, AMP gathers more detailed memory statistics per frame, which are displayed in the memory tab. This option also causes AMP to display the full list of images in the Images tab, rather than a maximum of ten.
- Profiling Level: This drop-down control allows three levels of function profiling: “Low,” “Medium,” and “High.” A low level of profiling causes AMP to time only some high-level C++ functions. A medium level of profiling results in ActionScript functions being timed as well as the functions from the previous level. A high level of profiling also gathers data from some lower-level C++ functions. In addition, the high level of profiling keeps track of the time spent in each line of ActionScript 2 code, which is displayed in the Code panel for the selected frame. A debug file (SWD) is required in order to show source line timings. In the case of ActionScript 3, these timings are always shown.
- Zoom toolbar: Consists of a drop-down control that alters the horizontal scale of the graphs. Zooming out allows identification of problem areas of the run, and zooming in allows more precise examination of those areas. The mouse wheel can also be used for zooming in and out, and provides a higher resolution not available via the drop-down. The toolbar also displays the currently selected frame number.
- Status bar: At the bottom of the profiler is a Status bar that shows the current connection and bit rate of the received information over the network.
AMP allows the user to customize its appearance. The locations where the toolbars and tabs are docked may be changed by dragging them to their new locations. The tabs and toolbars may be undocked from the application. The sizes of the graphs and the tabs may be adjusted, and the graphs may be either partially or totally collapsed. The state of these UI changes is persistent over AMP profiling sessions, but the user can reset the geometry to its default state from the Reset UI selection in the Window menu.