
The trace stack can be used when debugging a program.
Note: The Visual LISP IDE is available on Windows only.
- In the Visual LISP text editor, set a breakpoint or suspend the execution of your AutoLISP program.
- Click View
 Trace Stack.
- In the Trace Stack window, double-click the element or frame you want to inspect.
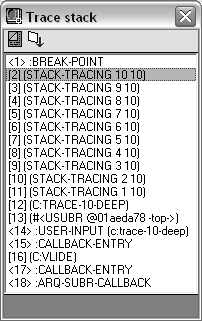
The Trace Stack window displayed shows a function call frame for the stack-tracing function. The second element, or frame, in the trace stack is highlighted:
[2] (STACK-TRACING 10 10)
The number [2] simply identifies it as the second element in the stack. The numbers following the stack-tracing function name (10 10) indicate the actual values that were passed to the function.