
After you create an AutoLISP (LSP) file and add code statements to the file, you can connect Visual Studio Code to AutoCAD and step through your custom functions using many of the debug tools that Visual Studio Code offers.
Prerequisites
Topics in this Tutorial
Open an AutoLISP (LSP) File
Before debugging an LSP file, it is recommended to first open the LSP file you want to debug. The LSP file open in the current editor window will be loaded into AutoCAD when Visual Studio Code is initially connected to AutoCAD for debugging.
The following steps explain how to open the Create-LSP-Tutorial.lsp file in Visual Studio Code.
- Launch Visual Studio Code.
- In Visual Studio Code, on the Activity Bar, click Explorer.
- On the Explorer view, under LSP Files, click
Create-LSP-Tutorial.lsp to open and make it the current editor window.
If the LSP Files folder is not open, click File menu > Open Folder/Open. Then browse to and select the LSP Files folder.
Attach to AutoCAD and Load an AutoLISP (LSP) File for Debugging
After the AutoLISP Extension has been properly configured and an LSP file is open in the current editor window, you are ready to debug the AutoLISP code statements stored in the LSP file with Visual Studio Code.
The following steps explain how to attach Visual Studio Code to AutoCAD for debugging.
- Launch AutoCAD 2025.
- Switch to Visual Studio Code.
- In Visual Studio Code, click Run menu > Start Debugging.
- From the Configurations menu, choose AutoLISP Debug: Attach.
- In the Processes menu, choose the process that represents your running instance of
AutoCAD 2025.
Visual Studio Code should now be attached to AutoCAD with the LSP file in the current editor window loaded into the current drawing window.
You can tell if Visual Studio Code has successfully been attached to AutoCAD by the change in color to Visual Studio Code's status bar, it will change from Blue to Orange in color.

- Switch back to AutoCAD.
- At the Command prompt, enter hello.
- At the
Enter a message: prompt, type
Hello from AutoCAD! and press Enter.
A message box appears with the text "Hello from AutoCAD!".
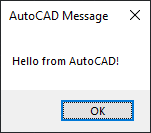
- Click OK to close the message box.
- At the Command prompt, enter
drawline. Specify the two endpoints for the line.
A line is drawing between the specified points and is placed on the current layer.
Add Breakpoints to Statements
Breakpoints allow for the interruption of code statements as they are being executed. When execution is interrupted, you can:
- Step through the current and next statements in your custom program one line at a time
- Evaluate the current value assigned to a variable or returned by a function
The following steps explain how to add breakpoints to the Create-LSP-Tutorial.lsp file open in the current editor window.
- Line Breakpoint
-
- Switch to Visual Studio Code.
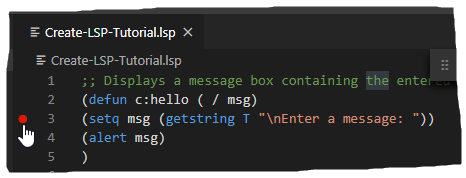
- In the editor window, in the left margin, click to the left of Line 3 to add a breakpoint at the beginning of the code statement on that line.
A red circle appears indicating a breakpoint has been added.
- Switch to AutoCAD.
- At the Command prompt, enter
hello.
The hello function is started and code execution is interrupted at the line with the breakpoint.
- Switch back to Visual Studio Code.
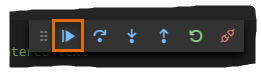
- On the Debug toolbar, click Continue to resume execution.
- Switch back to AutoCAD and enter a text string to display in the message box.
- Click OK to close the message box.
- Inline Breakpoint
-
- Switch to Visual Studio Code.
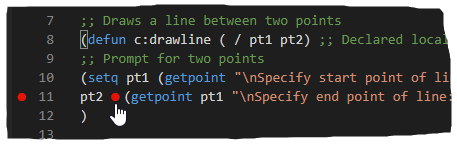
- In the editor window, on Line 11, click to the left of the opening parenthesis.
- Right-click and choose Add Inline Breakpoint to add a breakpoint at the beginning of the nested AutoLISP expression.
- Switch to AutoCAD.
- At the Command prompt, enter drawline.
- Specify a point for the start point of the line.
After specifying the first point, execution is interrupted by the inline breakpoint.
- Switch back to Visual Studio Code.
- On the Debug toolbar, click Continue to resume execution.
- Switch back to AutoCAD and specify a point for the endpoint of the line.
Watch Variable Values and Return Values of Statements
When execution is interrupted by a breakpoint, you can see the current value assigned to a variable or the value returned by a code statement.
In the previous section, you set two different breakpoints. The following steps utilize those breakpoints to interrupt code execution and view the value assigned to a variable.
- Switch to AutoCAD.
- At the Command prompt, enter drawline.
- Specify the start point of the line.
- Switch to Visual Studio Code.
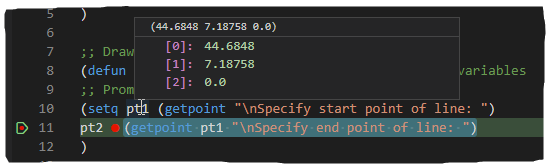
- Move the cursor over the
pt1 variable above or in the highlighted statement to view the current value assigned to the variable.
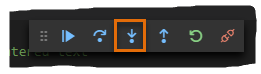
- On the Debug toolbar, click Step Into.
- Switch back to AutoCAD and specify the second point.
- Switch back to Visual Studio Code and click Step Into again on the Debug toolbar.
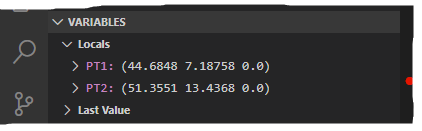
- View the value assigned to the
pt2 variable.
Along with positioning the cursor over a variable to view its current assigned value in a tooltip, the values assigned to all local variables can be viewed in the Variables section on the Run view.
- On the Debug toolbar, click Continue to resume execution.
Reload an AutoLISP (LSP) File while Debugging
It is inevitable, while debugging your custom programs that you will encounter an error that needs to be fixed. Once fixed, you will want to test the changes made.
The following steps explain how to make a change to the drawline function and the reload the LSP file into AutoCAD while debugging with Visual Studio Code.
- Switch to Visual Studio Code.
- In the editor window for the
Create-LSP-Tutorial.lsp file, make the following changes in bold below:
;; Draws a line between two points
(defun c:drawline ( / pt1 pt2 sv_clayer) ;; Declared local variables
;; Store the current and create a new layer
(setq sv_clayer (getvar "clayer"))
(command "_.-layer" "_m" "Object" "_c" "5" "" "")

;; Prompt for two points
(setq pt1 (getpoint "\nSpecify start point of line: ")
pt2 (getpoint pt1 "\nSpecify end point of line: ")
)

;; Check to see if the user specified two points
(if (and pt1 pt2)
(command "_.line" pt1 pt2 "")
(prompt "\nInvalid or missing point(s)")
)

;; Restore the previous layer
(setvar "clayer" sv_clayer)

;; Exit quietly
(princ)
)
- Save the changes to the LSP file.
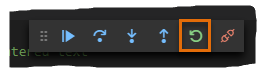
- On the Debug toolbar, click Restart.
Visual Studio Code disconnects from AutoCAD and then re-attaches to the same AutoCAD process before loading the LSP file in the current drawing.
- Switch back to AutoCAD.
- At the Command prompt, enter drawline.
- Specify the first and second points of the line.
Notice this time the line is placed on the Objects layer which is assigned the color of Blue.
End Debugging
After you are done debugging an LSP file, you should disconnect Visual Studio Code from AutoCAD.
The following steps explain how to disconnect Visual Studio Code from AutoCAD.
- Switch to Visual Studio Code.
- On the Debug toolbar, click Disconnect.
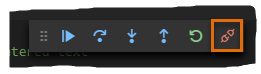
The Debug toolbar closes and the status bar changes from Orange back to Blue in color.