The zebra analysis tool projects stripes onto a surface so that you can inspect the continuity between surfaces.
Surface continuity is a measure of how smoothly two surfaces flow into each other. A car hood, for example, can be composed of multiple small surfaces that appear to be one because of the smoothness of the surface continuity. Zebra analysis can also identify flaws in what should be a fair surface in a ship hull, an issue that can increase drag and have structural consequences in some cases.
How to Interpret the Zebra Stripes
In the seam where two surfaces meet, the way that the zebra stripes align and curve tells you a lot about the smoothness of the join.
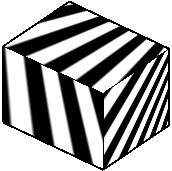
- G0 Position. The position of the surface edges is collocated; they touch. But the tangency and curvature do not match. The zebra stripes do not line up.
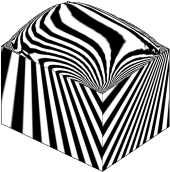
- G1 Tangency. The position and tangency of surfaces is the same. This indicates G1 (G0 + G1 or position + tangency). The zebra stripes line up, but they veer away from one another at sharp curves.
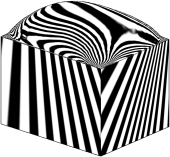
- G2 Curvature. The position, tangency, and curvature of the surface edges is the same. This indicates G2 (G0 + G1 + G2 or position + tangency + curvature).
The stripes line up, but they do not veer away from each other at sharp curves (because they share the same curvature). This distinction is subtle and a little harder to discern from G1 continuity.