
Use the Volumes Dashboard to analyze volume surfaces and bounded areas within those surfaces.
Using the Volumes Dashboard you can:
- Calculate volumes in multiple volume surfaces and in bounded areas within the volume surfaces.
- Save volume information between drawing sessions. The entries you make in the Volumes Dashboard are persistent between drawing sessions.
- Select multiple surfaces and bounded areas to show in the total volumes graph.
- Insert a summary of the volumes into the drawing.
- Generate a volumes report.
|
Calculate a site's cut and fill volumes and see the calculations change dynamically as you modify the surface. |

 00:04:30
 With Audio
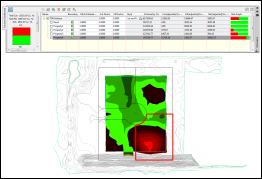
Each volume surface and bounded area that you add to the Volumes Dashboard has a
 check box next to it in the Volumes Dashboard. Select the check box
 next to a volume item to include the item in the total volumes graph, a report, or a cut/fill table.
Note: The total volumes graph does not display a representation of the volumes if no surfaces or bounded areas are selected, if both a volume surface and an associated bounded area of that volume surface are selected at the same time, or if any of the selected volume surfaces are out of date.
![]() Workflow: To Analyze Surface Volumes Using the Volumes Dashboard
Workflow: To Analyze Surface Volumes Using the Volumes Dashboard