
Adjusting the Colour Range
You can use the Histogram menu to adjust the range of values used for the red, green, blue, or luminance channels of an image. The histogram shows the colour distribution of pixels in the front and result image for the selected channel. The horizontal axis represents the values of pixels, from black at the left to white at the right. The vertical axis represents the number of pixels with these colour values.
When working with 16-bit floating point images, the values of the histogram are represented on a logarithmic scale. When working with integer images (8, 10, or12-bit), the values of the histogram are represented on a linear scale.
To access the Histogram menu:
Click the Histogram tab.
The Histogram menu options are described as follows.
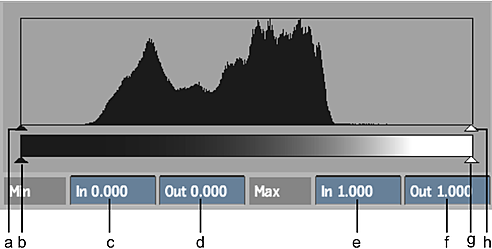
(a) Minimum Input slider (b) Minimum Output slider (c) Minimum Input field box **(d)**Minimum Output field (e) Maximum Input field (f) Maximum Output field **(g)**Maximum Output slider **(h)**Maximum Input slider
Input controls
Use the minimum and maximum input sliders or fields to set the input levels of your image.
Output controls
Use the minimum and maximum output sliders or fields to set the output levels of your image.
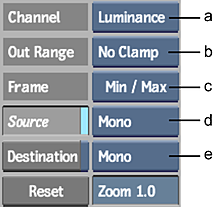
(a) Channel Selection box (b) Out Range Option box (c) Frame Selection box (d) Source View Option box (e) Destination View Option box
| Select | To Frame: |
|---|---|
| Min / Max | Based on the minimum and maximum slider values. |
| Full Range | The complete range of histogram values. |
| Plot Colour | The plot and reference colours. |
| Home | Based on a [0:1] horizontal and vertical range. |