
The selection dialog is displayed when viewing simulation results using
the graph pick tool ![]() on the
Tools Toolbar. The graph pick tool is used to display a graph of time varying
data for a single network object.
on the
Tools Toolbar. The graph pick tool is used to display a graph of time varying
data for a single network object.
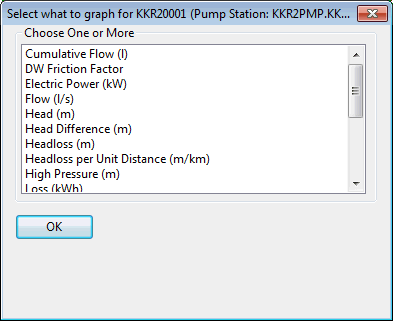
The dialog offers a choice of time varying data to graph. The list will be appropriate to the type of network object selected.
Select the data to graph and click OK to display the Graph view. More than one parameter can be selected for graphing by using the Ctrl and SHIFT keys.
Adding control profile data to the graph
Control Profile data can be graphed for the following network objects:
- Nodes that are control nodes for:
- Pumping Station, where Mode of Control = PROF
- Valve, where Mode ID = PRV or PSV
- Pumping Station, where Mode of Control = FLOW
- Valve, where Mode ID = FRV
The Add Control Profile check box in the bottom right corner of the dialog will become available when graphing flow, pressure or depth attributes for the above objects. Check this box to add an extra trace showing the control profile values.