
Using the Histogram Plot Command
Prerequisites
These steps assume you have run an analysis and/or have access to results data.
To launch the Histogram Plot command
- Open your Moldflow product and load the study results.
- Click
 (Home tab > Histogram panel > Histogram) to enable the histogram plot.
To enable a disabled Histogram Plot command
This information is valid only for those results that ordinarily support the Histogram Plot, such as the Fill Time result, but where the Histogram Plot has been disabled because of 1D beam elements in the runner system.
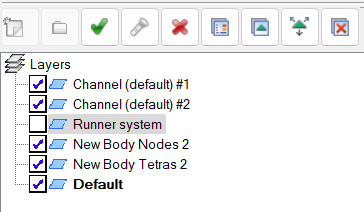
Place your runner system on a separate layer (see related pages at the bottom of the page to learn how to do this).
Hide the runner system layer.
The Histogram Plot command is activated and you can examine the data for the rest of the model.