
Depending on the system, the model may take a few minutes to solve. Unlike a linear static analysis, a single
Results item will appear in the tree. This is how multi-output results are handled.
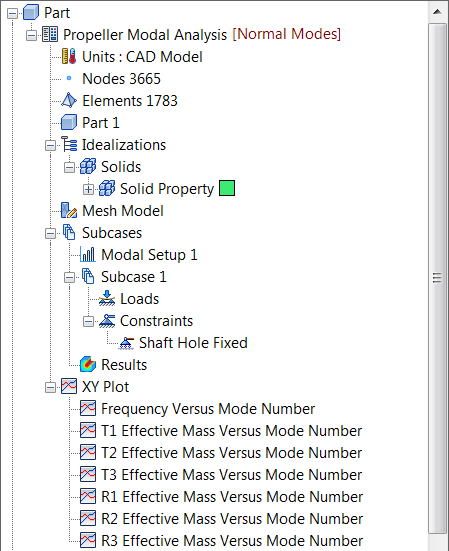 Nastran calculates the displacements to graphically represent the modal shapes for each eigenvalue extracted.
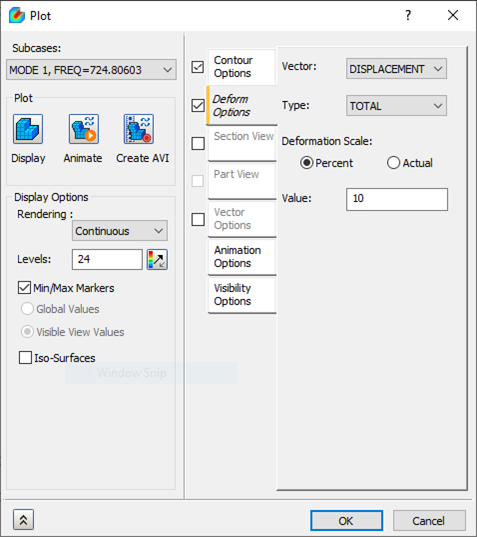
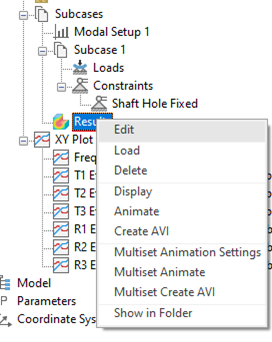
- Right-click on Results in the tree and select Edit.
- On the Contour Options tab, from the Subcases drop-down menu select MODE 1, from the Result Data menu select Displacement, and ensure that Type is set to TOTAL.
- Deselect the
Deform Options checkbox, then click the
Display button.
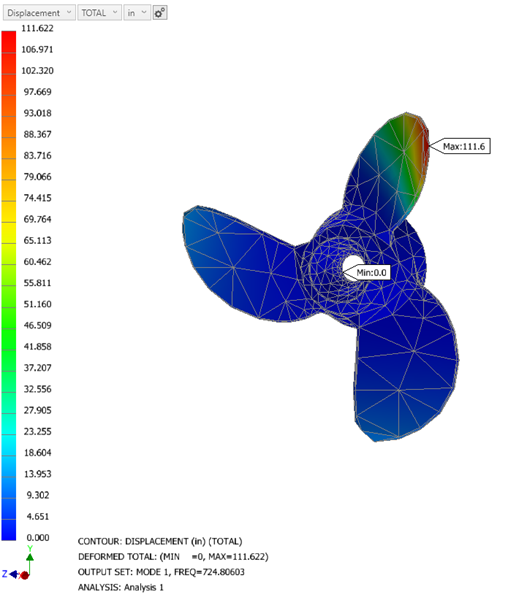
- The first and lowest frequency is about
750 Hz. In this case, it is a bending mode. Select the
Deform Options checkbox, then click
OK.
- The undeformed edges is overlaid on the contour to show the relative displaced shape. Here, the element edges are not displayed for visual clarity.
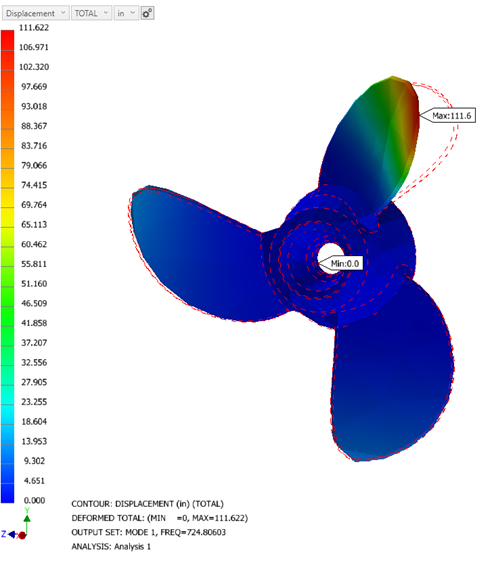
In the first mode, the propeller blade bends out of the plane of the undeformed blades, displaying a bending mode shape.
- Right-click
, and under Subcases, select
Mode 6, then click
OK.
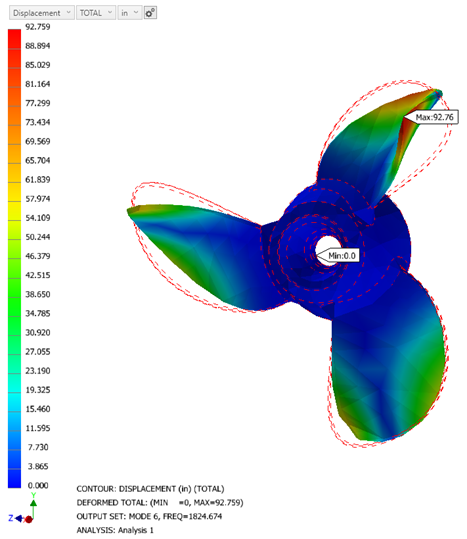
Mode 6 displays a twisting mode. Again, displayed with the element edges turned off and alongside the undeformed edges to show relative displacements.
 If the Max and Min labels are in the way, they can be turned off in the Display Options section of the Plot Property dialog along with the element edges.
Animate the Results
- In the tree view, right-click on
Results and select
Edit.
- From the Subcases drop-down menu select MODE 1. Make sure that Contour and Deform boxes are checked.
- Click on the
Animation Options tab, and set the following values:
- Number of Frames = 25
- Delay (msec) = 20
- Mode = Oscillate
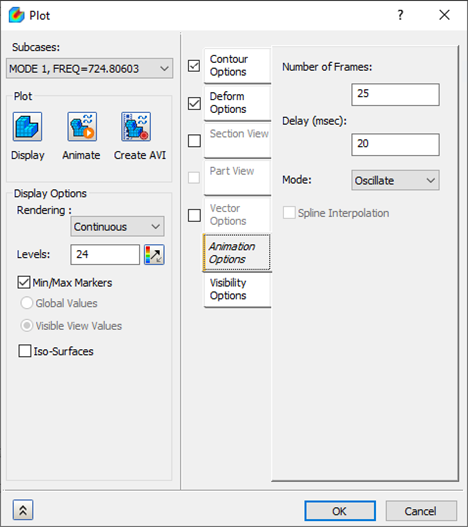
- Click OK.
- Right-click on Results and select Animate. You should see the contour and deformation animated.
- Right-click on Results and select Animate once more to stop the animation.
- Right-click on Results and select Edit.
- Uncheck the Contour checkbox. Notice that the displacement contour plot is no longer being interpolated along with the deformation plot.
This concludes Normal Modes Analysis of a Propeller.
The main topics covered were as follows:
- How to set up and run a simple normal modes analysis.
- How to interpret the frequency or eigenvalue extraction results.
- How to set up and run a simple animation.