
Section and Beam Graphic - Chart Toolbar
Description
This side toolbar allows the results charts and graphs to be formatted.
It is only available when the view in the graphic window is of a graph.
Outline Procedure
Click on the Chart tab on the right hand side of the graphic window. This toolbar will fly out.
The format of the graph or chart is modified whenever a setting in this toolbar is changed.
Chart colours are set in the 'Graphics' tab of the 'Preferences' form.
 Pin / Unpin
If the toolbar is 'pinned' (icon vertical) then it permanently occupies a fixed area of the Graphics Window.
If the toolbar is 'unpinned' (icon horizontal) when the cursor moves beyond toolbar area then the toolbar is minimised into the side status bar containing the Chart tab. Only the Chart tab is visible and the screen area formerly occupied by the Chart Toolbar is occupied by the Graphic Window. If the cursor is placed over the Chart tab then the Toolbar is maximised and remains active until the cursor moves off it.
A left click on the pin icon toggles between 'pinned' and 'unpinned'.
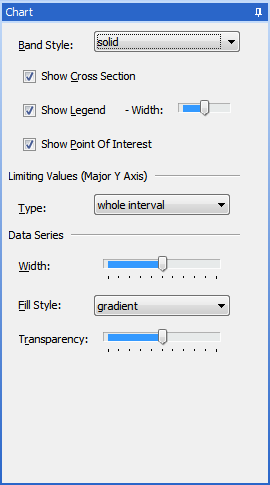
Chart Toolbar Graphic
Field Help
Band Style
This defines the appearance of the horizontal bands that form the background to the chart or graph and which define the scale of the ordinates (y-values) of the graph or chart.
Show Cross Section
If this box is checked then the cross-section that corresponds to the elevation (at the point of interest) is also shown.
Show Legend
If this box is checked then a legend is displayed, giving the 'key' (line colour and style) of each graph or chart item.
Show Legend - Width
This slider changes the relative proportions (height/width) of the legend to enable it to be more easily fitted in the view.
Show Point of Interest
The point of interest is a single 'design station' (e.g. change in tendon profile) that is identified by a vertical line (abscissa) in the view. The point of interest may be repositioned by mouse click-drag.
The ordinates (y-values) of each chart or graph item at the point of interest are shown to the right of the graph.
If this box is checked then the point of interest and current values are shown. Otherwise not.
Limiting Values (Major Y Axis)
This selection defines the ordinates (y-values) of the extents of the graph or chart.
| Type | Description |
|---|---|
| whole interval | The envelope of extreme ordinates in the data but extended so that all bands are shown in full. |
| data limits | The envelope of extreme ordinates in the data. |
| user defined | Two fields ('Max' and 'Min') allow the user to define the maximum and minimum extents of the ordinates of the graph. |
Data Series - Width
If the chart or graph is being viewed isometrically this slider adjusts the width (normal to the plane of the graph) of the 'ribbons' showing the results.
Fill Style
This defines the appearance of the shading of the fill between the graph or chart and the origin ordinate (y=0).
Transparency
This slider simultaneously adjusts the 'saturation' (i.e. strength of tone) of the shading of both the data series 'ribbons' and the data series 'fill'.