The Output Grapher allows you to examine various results from the simulation. The following is a list of some of the things you can do after running a simulation:
- Display vectors for internal or external forces.
- Change reference frames to view results in various coordinate systems.
- Display curve results.
- Save the simulation results for later review and comparison.
- Display results in terms of time or other criteria.
- Display traces to visualize trajectory of component points.
Display Traces
- After running the simulation, and before leaving the run environment, click the Output Grapher command.
The Output Grapher window is divided into different sections: browser, graph, and time steps. Output Grapher commands are located in a toolbar across the top of the window. The window is resizable, so adjust it to meet your needs.
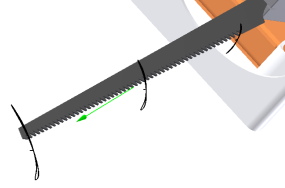
- Click Add Trace
 . The dialog box displays, and the Origin selector is actively awaiting an input. Select the point at the end of the saw blade.
 - In the dialog box, check the Output trace value option and click Apply.

- Add two additional trace points along the saw blade in the same manner, and be sure to export the trace for each point.

- Close the dialog box.
Set Trace as Reference
- In the Output Grapher browser, expand Traces.
- Expand Trace:1, and then Positions.
- Right-click P[X], and click Set as Reference.
- Use the Output Grapher Save command to save the Simulation.
- Enter the name RecipSaw_tutorial_1.iam, and click Save.
- In the grapher browser, right-click P[X] and uncheck Set as Reference.
- Close the Output Grapher.
- Click Construction Mode in the Simulation Player.
As you can see, you can save simulation data, make changes, and compare the change results with the previous data.