In this task, you compare results between the two gate locations.
-
Click the Results tab to open it.
-
Double click the study Panel End Gate to open the study.
Both studies now open.
-
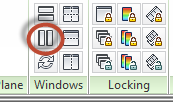
Click to show both studies side by side.
(You could also tile horizontally if you wish.)

-
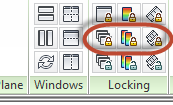
Click , then Lock All Plots, and Lock All Animations.

By locking, both studies have the same rotation, results and animations.
-
Click Fill Time in the Study Tasks list.
-
Rotate, Pan, and Zoom the model as necessary to inspect the fill time result.
-
Click to animate the result.
Use the other animation tools to see what they do.The filling pattern is unidirectional and balanced with the gate location on the bottom edge. If the gate was moved along the edge, the filling would not be as balanced.
-
Click Injection Pressure in the Study Tasks list.
The injection pressure with the new gate location is now under the 70-MPa guideline.