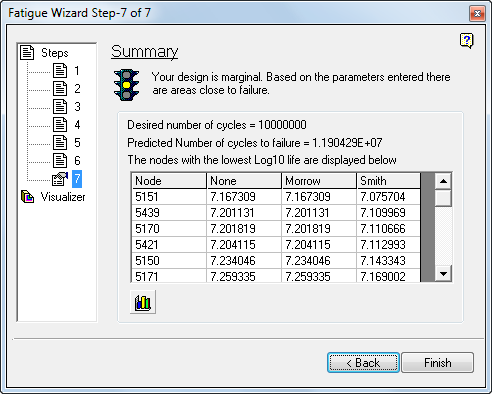
Step 7 provides a summary of the calculated fatigue results. It is a quick indication of the suitability of your components to withstand the applied loading condition. The traffic light symbol indicates whether the results are acceptable, marginal, or unacceptable when compared to the desired values entered on Step 5.
Traffic Lights
The Traffic Light calculation takes the fatigue result and divides it by the desired result (entered in Step 5). The traffic light symbol is then chosen based on the worst value calculated for the entire model. You see one of the following:
 Green indicates that there are no factored results (life or FSF) less than 1.3.
 Yellow indicates that there are no factored results less than 1.0, but there are some values between the range of 1.0 to 1.3.
 Red indicates that there are factored results less than 1.0.
Caution: THIS REPRESENTS A POTENTIALLY UNACCEPTABLE RESULT. INVESTIGATE IT FURTHER.
Node List
The summary report lists the 200 nodes with the lowest Log10 life or lowest FSF for the different correction methods analyzed.
To plot this data, press the  button. The following is a typical graph:
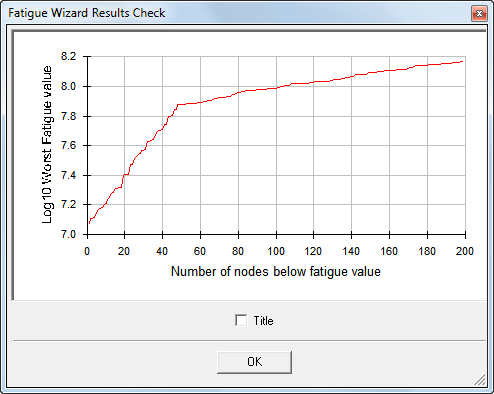
This graph is useful as a simple model quality check. A quick inspection of the graph shows if the lowest life is associated with just a few nodes, which is sometimes an indication of poor loading/restraining or mesh quality issues.
Finishing
The next options in the analysis cycle are as follows:
- Step backwards through the Fatigue Wizard to change some input data and calculate again.
- Use the Visualizer to inspect the results graphically. You can also access the Report Writer from the Visualizer.
- If you are finished with the Fatigue Wizard, click Finish to write the results. Then you can view them in the Results environment of Autodesk Simulation Mechanical. Use the appropriate menu, based on the results calculated under the "Results" pull-down menu. Note: If the model for which you just completed fatigue analysis is still open in Simulation Mechanical, you may have to close and reopen the Results window for the fatigue results to be loaded and available within the Results environment.