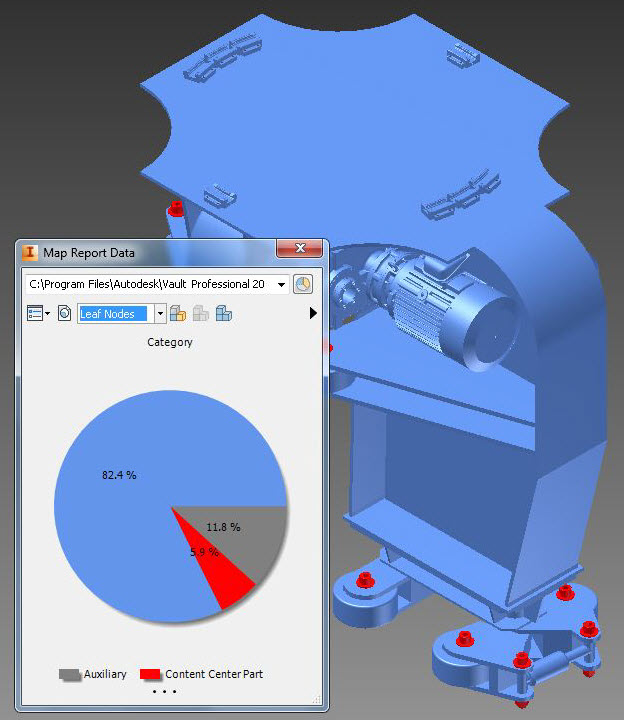
The Data Mapping feature allows you to easily assess important business data for your model. Report data is mapped on to the model to provide visual output of the correlation between report results and the open model. Mapping the report to the model colors the model to match the corresponding chart elements. The entire chart can be mapped onto the model, or you can choose which chart elements to map.

The chart displayed in the report control summarizes the actual values for the open model. However, the data mapped to the model may show different results, depending on the level of the model hierarchy included. You can specify the level at which the data mapping is applied from three options:
- First level children
- All assemblies (the value mapped to the lowest level assembly will take precedence over all others)
- Leaf node
Rules for Data Mapping
Data mapping is a useful tool for viewing different levels of data in a model. However, because the model hierarchy can be mapped at different levels, it is important to know from where the data is being collected to accurately interpret the results. Additionally, you should also know how file attachments affect the report results.
File Attachments
A report is generated using all of the files in the current model, including attachments. As a result, the chart may not have a 1:1 correlation with the files displayed in the canvas.
For example, a pie chart slice may indicate that a large percentage of files is currently in the Work in Progress (WIP) state. However, when mapping the data onto the model, only a small number of files are color coded to the WIP slice. This difference in display is because the slice is taking into account the attached files as well as the part files but only the part files are visible on canvas. You can view the full report to see a complete list of files that make up a pie slice.
Mapping Report Data to the Model Hierarchy
When a report is generated, the reporting system evaluates the files without knowledge of their relationships. The resulting chart represents actual flat data. Since a model has several levels to it, you have the option of mapping your data as three different levels to better understand the report data. This versatility allows you to examine model data at the parts level, the assemblies level, and the first children level. By examining all three levels, you will have the most complete picture of the report results.
Leaf Node Mapping
Leaf Node mapping is the most granular view of the model. Only parts within assemblies are mapped. This level is used most often early in a project to see where components are in the development process.
All Assemblies Mapping
All Assemblies mapping provides a perspective of the report results as they relate to the assembly level and first level parts. The color of an assembly determines the color of its parts but subassemblies are assigned their own colors.
First Level Children Mapping
First level children mapping is the least granular view. All parts and assemblies within each first level child are given the same color as the first level child.
Enable Data Mapping
Data Mapping must be enabled before you can generate reports or map any model data for review.
- Click Map Data on the Autodesk Vault ribbon to launch the Map Report Data dialog.
By default, the report control contains no report results.
Related Topics