The Simulation CFD Results tasks help you accomplish two primary goals:
- Visualize Results
- Extract Results Values
1. Visualize Results
Use Planes and Iso Surfaces to display results directly on the model.
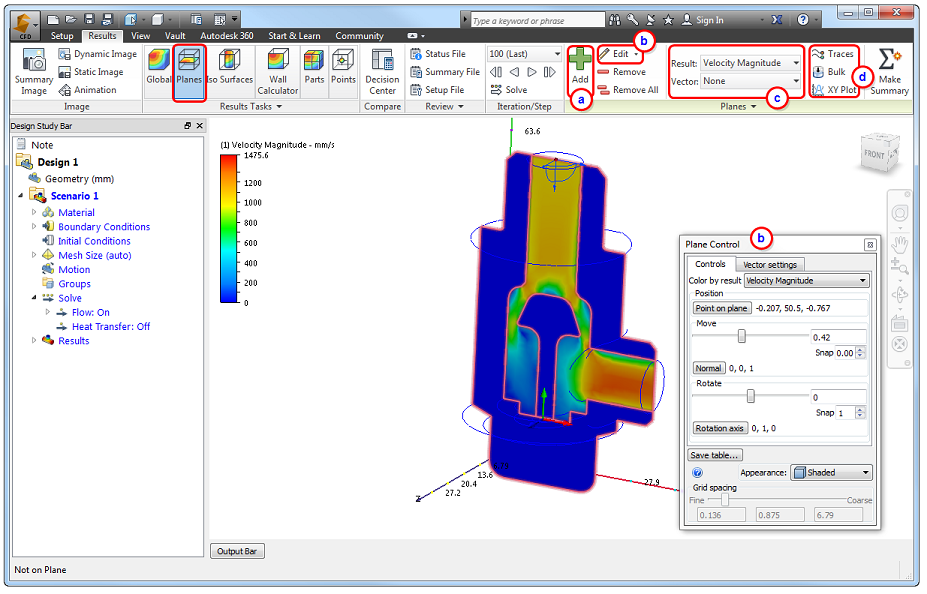
Planes
Planes show results on a two-dimensional slice through the model. Several associated tools (Particle Traces, Bulk Results, and XY Plots) provide a deeper understanding of the results.
You can work with planes in two ways: with the Planes context panel in the Ribbon and directly on the model. These workflows are complementary, and you can combine them to suit your preferences.
Workflow 1: Planes Context Panel
- To create a Plane, click Add.
- To modify the appearance, location, or result, click Edit. Modify the plane using the Plane Control dialog.
- To change the displayed result, select from the Result and Vector menus.
- To create particle traces, XY plots, or extract bulk-weighted results, select the appropriate tool on the Planes context panel.
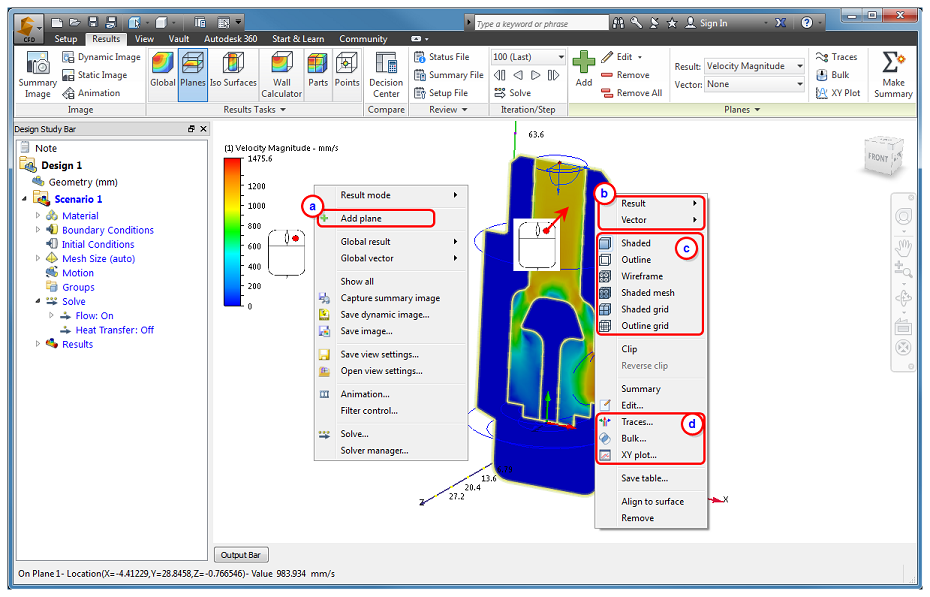
Workflow 2: Directly on the Model
- To create a Plane, right click off the model, and click Add plane.
- To change the displayed result, right click on the plane, and select from the Result or Vector menus.
- To modify the appearance, right click on the plane, and select the desired option.
- To create particle traces, XY plots, or extract bulk-weighted results, right click on the plane and select the desired tool.
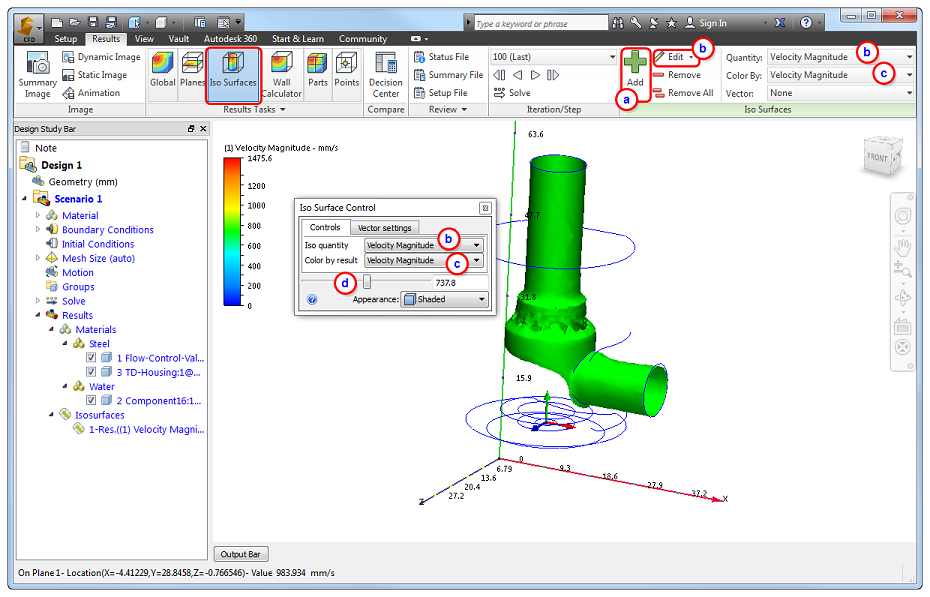
Iso Surfaces
Iso surfaces show a three-dimensional view of the results field. They do this by illuminating every location in the model that has a particular value of the specified result quantity.
- To create an Iso Surface, click Add.
- To change the iso result type, click Edit, and select from the Iso quantity menu. You can also select from the Quantity menu.
- To change the result displayed on the iso surface, select from either the Color by result menu or the Color By menu.
- To change the iso surface value, drag the slider on the Iso Surface Control dialog.
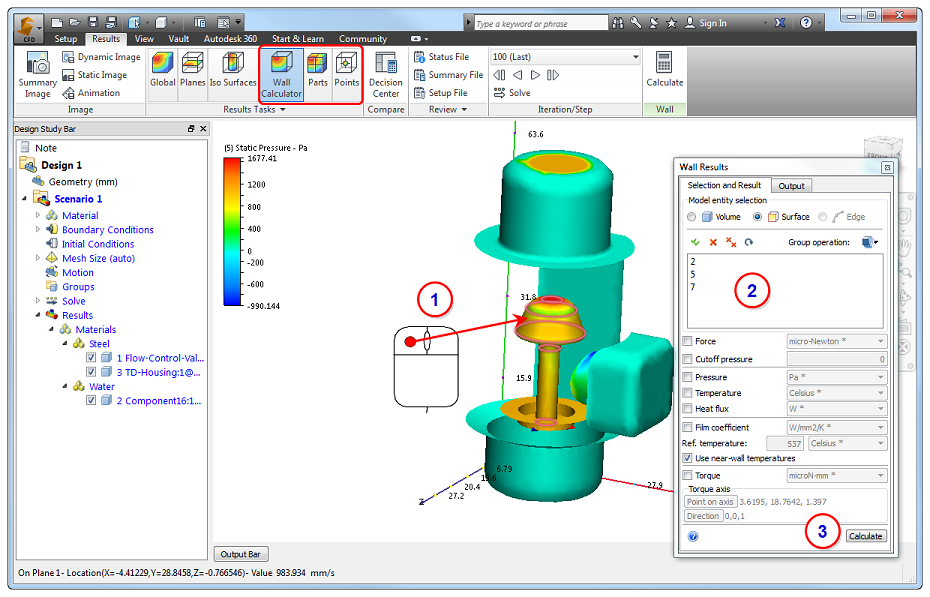
2. Extract Results Values
In addition to visualizing data, you can extract specific values using the Wall Calculator, Parts and Points tools.
- Use the Wall Calculator to understand how the fluid affects immersed solids and walls. The Wall Calculator is often used to extract flow-induced forces (hydrodynamic or aerodynamic) as well as heat lost or gained through walls.
- Use Parts to extract temperature results from fluid and solid parts and performance data from internal fans and compact thermal devices.
- Use Points to extract the time- or iteration-history at specific locations (points). Results Points are often used for transient simulations to plot how a quantity changes with time.
These three tools have a similar workflow:
- Select the model entity to review. This is a part for the Parts task or a surface for the Wall task.
- In the quick edit dialog, input parameters:
- For the Wall Calculator, select the quantities to assess.
- For Points, input or select a location.
- To view data:
- For the Wall Calculator and Parts, click Calculate.
- For Points, click View plot to plot results from saved iterations at the selected location.