Load-displacement plots are commonly used as a tool to determine the global stiffness response of a structure.
They are particularly useful for progressive failure analyses since they are a simple means of determining how the structure behaves as failure initiates and progresses.
- Click .
- In the dialog that appears, click the Add Data icon (green plus sign).
- Select . Click OK.
- From the graphics window, select the node where the vertical displacement was applied (refer to the Define the Load section). Click OK.
- Repeat steps 2-4, but select .
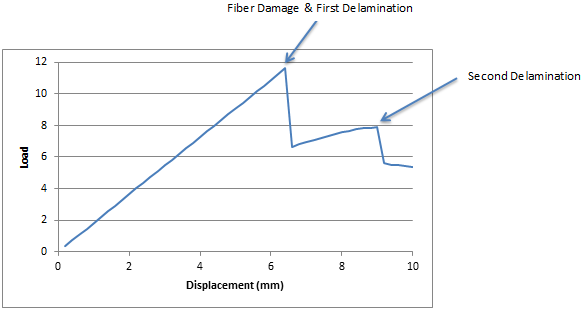
- To plot the reaction force vs. displacement, set the X-Axis to UY_2, select both UY_2 and FY_3, and click the Graph Data icon. Refer to the image below.

- Since we applied a compressive displacement, it may be more useful to export the data to a spreadsheet and plot the results in Quadrant I. With the load-displacement plot, we can easily identify the global damage events and correlate them to the contour plots shown previously.
 Note: Be sure to account for symmetry when calculating the reaction force of the beam.