Learn how to obtain and analyze stress diagrams/maps for the structure
- Continue working in your project or open the project Frame_3D_Analysis.rtd.
Note: The Tutorial files are located in C:\ProgramData\Autodesk\Examples\Tutorials.
- In the Standard toolbar, expand the Layouts drop-down menu and select Stress Analysis - structure as shown below:
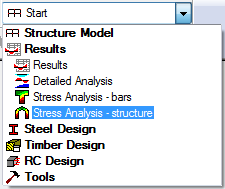
The layout is divided in three parts: View, Stress Analysis - Structure dialog, and Stress Analysis - Structure table.
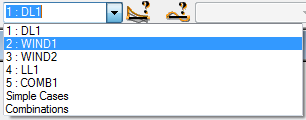
- In the Cases Selection box of the Selection toolbar, expand the Cases drop-down menu and select 2: WIND1.
- Click
 (Section shapes) at the bottom left of the drawing area to display section shapes for all the structure members.
 - In the Stress Analysis - Structure dialog:
- Go to the Diagrams tab, and then select Max in the Mises group,
- Go to the Parameters tab, and then select Filled in the Filling group.
- Click Apply.
A dialog appears showing the Calculation progress. When the calculations are finished the stress values are displayed graphically in the drawing area.
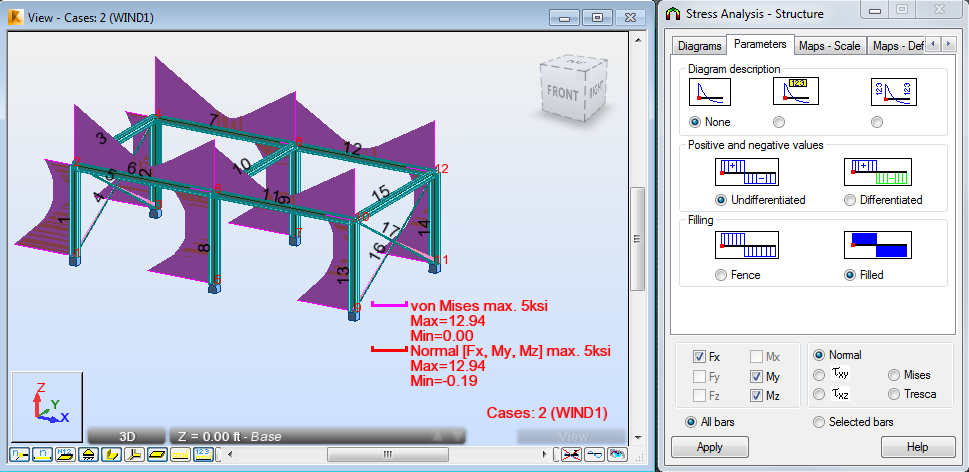 Note: The Stress Analysis - Structure dialog allows you to select a user-defined stress and a set of basic stress types such as normal, tangent, Mises and Tresca.
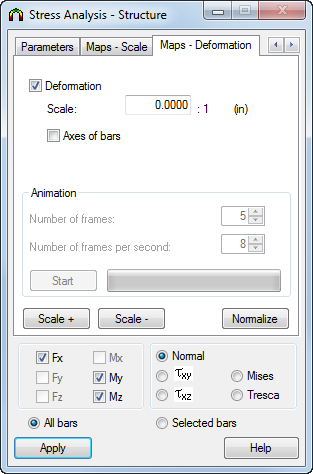
 - Go to the Maps - Deformation tab, select Deformation, and then click Apply. Select this option to display stress maps graphically on the deformed structure.
- Click
 (Results
  Stress Analysis Stress Maps).
An additional window opens and displays the structure with section shapes and accurate detailed stress maps, as shown below.
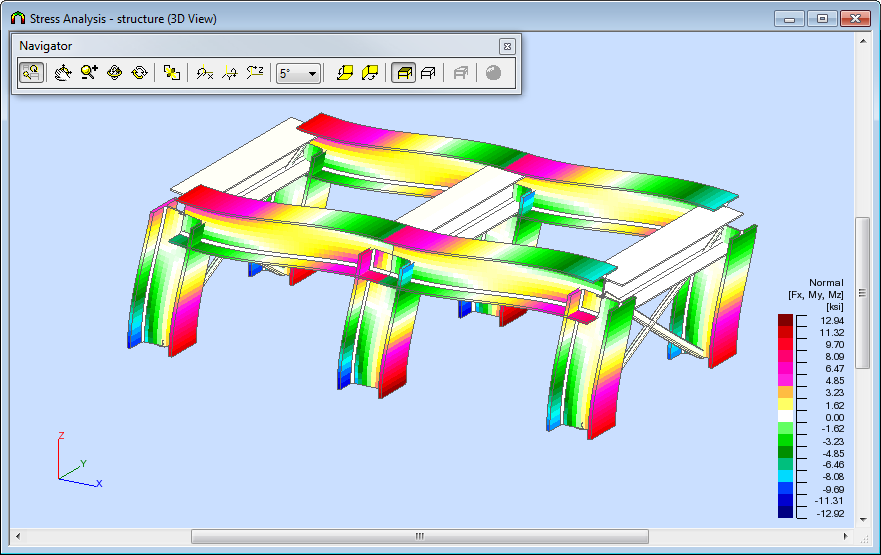 Tip: The size of member sections in stress maps is by default greater than the real size of the member sections so that the stress maps presented for these sections are more readable. Press the Home key on your keyboard to get real proportions between the member length and dimensions of the member cross section. You can also press the PgUp and PgDn keys to modify these proportions.
 - Close the Stress Analysis - structure (3D View) window.
- In the Stress Analysis - Structure dialog, go to the Diagrams tab, and then deselect Max in the Mises and User-defined group.
- Click Apply.
- Save the project as Frame_3D_Results.rtd.
Click here to go to the Summary.