Use 3D Structure Viewer to explore result types for static and gravity analysis. You can also display additional result types and detailed results for a element. If errors or warnings are reported during analysis, you can identify the elements causing them in 3D Structure Viewer.
To Display Results
- On the Results tab, from the Load Case list select a load case to display results for.
- Click a result type to display, such as Moments.
- If necessary, click a result subtype, such a Moments My.
You can select more result types to display. The extreme values for the selected result for the whole model display in the 3D view.
- Select a model element in the 3D view.
- Click the Explore detailed results
 icon to open the Detailed result view.
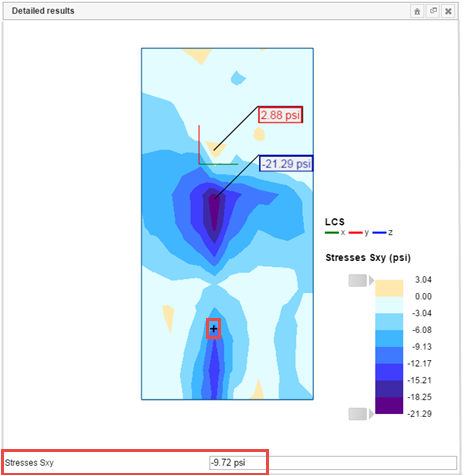
 It displays a view of the element selected in the model and extreme values of selected results for this element, maps for surface elements, and diagrams for members.
- In the Detailed result view, click on the element to select a point for which you want to display result values.
The selected point is marked with a black plus sign +. Values of results at this point display in the field under the element view.
In the detailed view, you can also manipulate with the element. To restore its original position, click the
 Home view icon in the top right corner of the detailed view.
You can simultaneously display several result types in the view and in the detailed view.
To Identify Elements Causing Warnings and Errors in the View
- Click Errors and Warnings tab. Note: The Errors and Warnings tab displays next to Results tab in 3D Structure Viewer if errors or warnings are reported during the analysis.
- On the list, click an error or warning to display.
In the view, model elements causing the selected error or warning are highlighted and their Revit Element IDs display.
 ).
). - Press the "." key on your keyboard to display the next error in the view
- Press the "," key on your keyboard to display the previous error in the view.
You can also display elements causing errors or warnings in the view, by clicking a warning on the list of warnings in a report.