We will now look at a few of the available results contours and the various display customization options.
Note: [Conditional Procedure] – If you previously ran the analysis and are returning to complete the tutorial in a separate session of Autodesk Nastran In-CAD, you must perform two additional steps upon reopening the CAD model. If you are continuing immediately from the Run the Analysis page (within the same Nastran In-CAD session), skip ahead to Step 1 in the Plot the Von Mises Stress and the Displacement Magnitude section of this page.
- Click
 Environments
 Begin Autodesk Nastran In-CAD to re-enter the Nastran In-CAD environment.
 - Click
 Autodesk Nastran Results Load Results. Then:
 - Navigate to your tutorial working folder.
- Select the file, Hanger Weldment_QST.fno.
- Click Open.
Plot the Von Mises Stress and the Displacement Magnitude
- Click Autodesk Nastran Results Options.
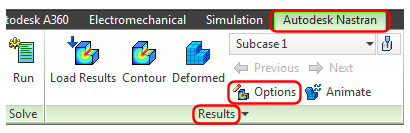
The Plot dialog box appears. Refer to Figure 1.a – 1.f for the following six steps.
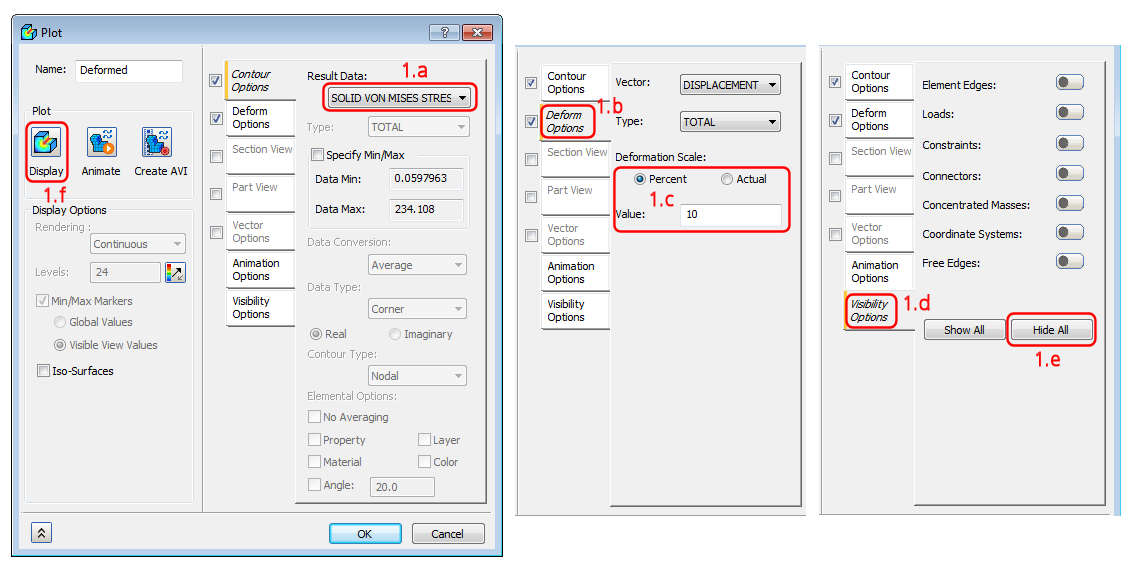
Figure 1.a – 1.f
- The initial Result Data setting for linear static stress analyses is SOLID VON MISES STRESS. This is the plot we will look at first. Verify that this is the selected result; but change the selection if necessary.
- Click on the Deform Options tab of the Plot dialog box.
- The default deformation is scaled to 10 percent of the model size by default. We will keep this setting so that the deformed shape is clearly visible. Tip: For large deformation nonlinear analyses, especially when there is free-body motion of one or more parts, it is best to show the actual displacement. In addition, when comparing multiple analysis subcases, or when creating a Multiset Animation, a fixed multiplier of the actual displacement produces the best visual results.
- Click on the Visibility Options tab of the Plot dialog box.
- Click Hide All. This action produces a cleaner contour plot, without mesh lines or constraint and load glyphs.
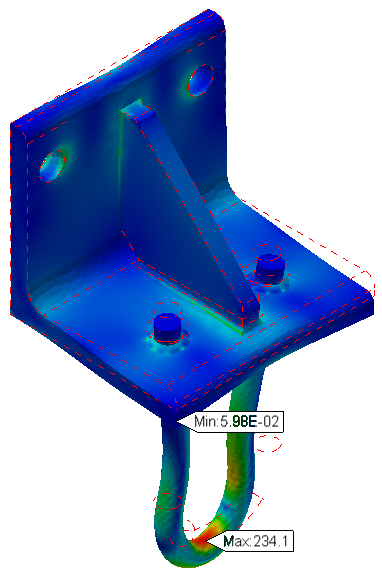
- Click Display. Your Von Mises Stress results should be similar to the following image:
- Click on the Contour Options tab of the Plot dialog box.
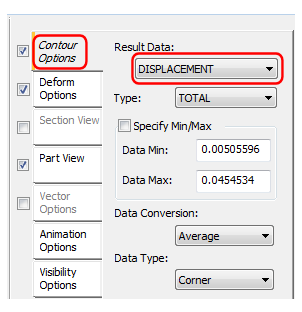
- From the Result Data pull-down menu, choose DISPLACEMENT. Your displacement contour plot should be similar to the following image:
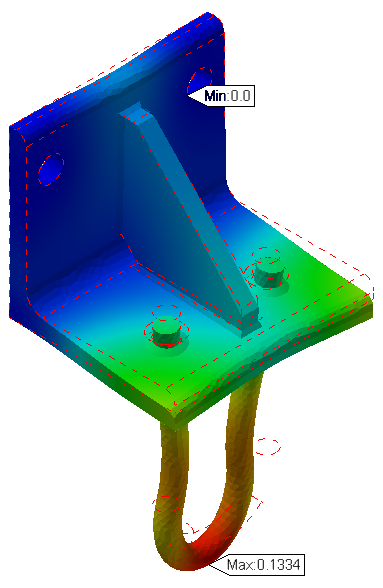
- From the Result Data pull-down menu, choose DISPLACEMENT. Your displacement contour plot should be similar to the following image:
Keep the Plot dialog box open; we will be using it further on the next page.
| Previous Topic: Run the Analysis | Next Topic: Evaluate the Safety Factor Results |