Use the annotation template you defined in the previous exercise to insert instances of the annotation into the drawing. Every drawing object that contains data for speed limit in the object data table will display its own speed limit value.
This exercise uses the map you edited in Exercise 1: Create an annotation template.
To attach annotation to drawing objects
- Select some streets in the drawing by clicking them.
For this exercise, select a few streets around the cloverleaf in the middle of town.

Select the streets around the cloverleaf.
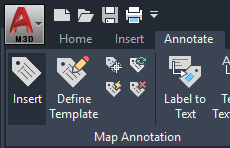
- Click Annotate
 Map Annotation
 Insert.
Click the Annotate tab to see the Map Annotation options.
- In the Insert Annotation dialog box, under Annotation Template, select the Speed check box.

Any other annotation templates defined in the drawing would also be listed here.
- Click Insert.

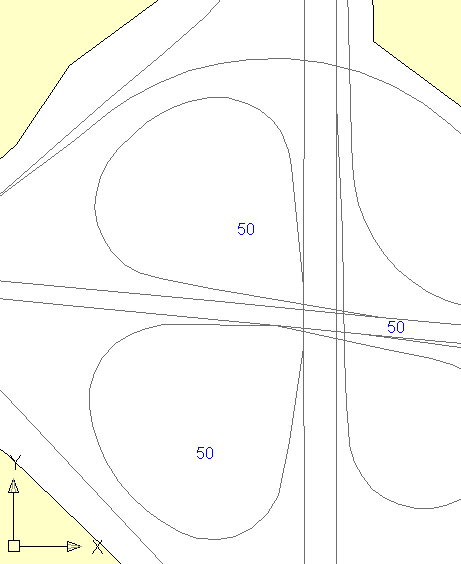
Speed limit values in blue text are added next to each street, based on the object data associated with the street objects.
- Use Save As (on the application menu
 ) to save the drawing with a new name.
 Make a note of the name and location of the drawing. You will close and reopen it again later.
To continue this tutorial, go to Exercise 3: Add a static text label.