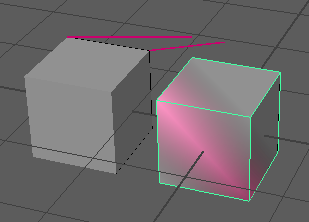
在 Viewport 2.0 中,可以可视化指定给多边形上的顶点、边、面和顶点面的元数据。另请参见在 Viewport 2.0 中可视化元数据。
按照这些准则,将元数据添加到对象的组件(在这种情况下为顶点),并使用 showMetadata 命令可视化元数据。
使用 showMetadata 命令可视化元数据时,可以查看不同对象上的不同流/成员组合,但是每个对象上只有一个流/成员。例如,可以同时可视化 Object1 上的 StreamOne 和 Object2 上的 StreamTwo,但是无法同时可视化 Object1 上的 StreamOne 和 StreamTwo。
-
若要将元数据添加到对象,请首先使用 dataStructure 命令定义数据结构,使用 addMetadata 命令创建数据流并将它们附加到对象;例如,如下所示:
// Define the data structure and create a data stream called StreamOne
dataStructure -format "raw" -asString "name=ColorStruct:float[3]=Color";
addMetadata -streamName "StreamOne" -channelName "vertex" -structure "ColorStruct" smcPlaneShape smcPlane1Shape;
注:不应将元数据添加到变形网格。
通常,更改 polyShape 的 inMesh 属性(即,polyShape 节点的输入属性)的拓扑的任何操作(例如,硬边修改)不会以相同方式修改传入的元数据,并且可能会导致意外的结果。
-
使用 editMetadata 命令将值指定给指定组件的元数据流。使用 -value 标志定义流中的元数据值,并使用 -index 标志指示要向其应用元数据的一个或多个顶点。
// Set StreamOne values and assign StreamOne to specified vertices on smcPlaneShape
editMetadata -streamName "StreamOne" -value 2 -value 0.5 -value 1 -index 1 smcPlaneShape;
注:或者,也可以通过首先选择顶点,在顶点上指定元数据:
select -r smcPlane.vtx[2:3];
editMetadata -streamName "StreamOne" -value 2 -value 0.5 -value 1;
上述操作等效于:
editMetadata -streamName "StreamOne" -value 2 -value 0.5 -value 1 -index 2 -index 3 smcPlaneShape;
- 若要可视化元数据,请使用 showMetadata 命令,并指示要显示的流、成员和成员的数据类型,使用 -Method 标志指示要用于显示元数据的模式。如果不指定模式,则使用颜色模式。
// Visualize StreamOne on smcPlaneShape
showMetadata -stream "StreamOne" -member "Color" -dataType "float[3]" -method "string" smcPlaneShape;
- 若要禁用可视化,请指定流名称并使用禁用标志。
可以指定对象名称以仅在该对象上禁用可视化。如果不指定对象名称且在场景中未选择对象,则在指定流和成员的所有对象上都将禁用可视化。
showMetadata -stream "StreamOne" -off -member "Color" -dataType "float[3]" smcPlaneShape;
在下面提供的示例演示了如何将元数据的两个流(StreamOne 和 StreamTwo)附加到两个对象(smcPlane 和 smcPlane1)上的顶点,以及如何在 Viewport 2.0 中逐个可视化数据流。它以禁用可视化结束。
// Start a new scene and create two cubes
file -new -f;
polyCube -n smcPlane -ch off;
pickWalk -d down;
move -r 1.5 0 0 ;
polyCube -n smcPlane1 -ch off;
pickWalk -d down;


// Define the data structure and create and attach the data streams to the two shapes
dataStructure -format "raw" -asString "name=ColorStruct:float[3]=Color";
addMetadata -streamName "StreamOne" -channelName "vertex" -structure "ColorStruct" smcPlaneShape smcPlane1Shape;
addMetadata -streamName "StreamTwo" -channelName "vertex" -structure "ColorStruct" smcPlaneShape smcPlane1Shape;


// Assign metadata values to the two streams
editMetadata -streamName "StreamOne" -value 0.25 -value 1.25 -value 2 -index 1 smcPlaneShape;
editMetadata -streamName "StreamTwo" -value -2 -value -0.5 -value 2.5 -index 2 smcPlaneShape;
editMetadata -streamName "StreamTwo" -value -4 -value -0.5 -value 2.5 -index 3 smcPlaneShape;
editMetadata -streamName "StreamTwo" -value -1.25 -value -0.75 -value 3 -index 4 smcPlane1Shape;
editMetadata -streamName "StreamOne" -value 6 -value 2 -value 3.5 -index 5 smcPlane1Shape;
editMetadata -streamName "StreamOne" -value 2 -value 0.5 -value 1 -index 6 smcPlane1Shape;


// NOTE: By default, all streams are hidden.
// Activate visualization of "StreamOne" for one cube. Use color mode.
showMetadata -stream "StreamOne" -member "Color" -dataType "float[3]" -method "color" smcPlane1Shape;

// Metadata is now visible.
// Auto remap the data range of the values in the stream.
showMetadata -stream "StreamOne" -member "Color" -dataType "float[3]" -method "color" -auto smcPlane1Shape;

// Enable color interpolation to extrapolate color to the faces surrounding the vertices
showMetadata -stream "StreamOne" -member "Color" -dataType "float[3]" -method "color" -interpolation true smcPlane1Shape;

// Activate visualization of "StreamOne" for the other cube. Use string mode.
showMetadata -stream "StreamOne" -member "Color" -dataType "float[3]" -method "string" smcPlaneShape;

// Metadata is now visible on both cubes.
// Now, activate visualization of "StreamTwo" for the second cube. Use ray mode.
showMetadata -stream "StreamTwo" -member "Color" -dataType "float[3]" -method "ray" smcPlaneShape;

// The rays appear too long.
// Scale the length using the rayscale flag.
showMetadata -stream "StreamTwo" -member "Color" -dataType "float[3]" -method "ray" -rayScale 0.3 smcPlaneShape;

// The visible metadata has now changed, and you have now used all three methods of display.
// Deactivate the stream.  To turn off visualization on an object, specify the stream name and use the off flag.
showMetadata -stream "StreamTwo" -member "Color" -dataType "float[3]" -off smcPlaneShape;

// Now metadata is no longer visible on the second cube (smcPlaneShape)
在此示例中,在 smcPlaneShape 上以光线模式可视化 StreamTwo,其中“光线长度比例”(Ray length scale)设置为 0.3,而在 smcPlane1Shape 上以颜色模式可视化 StreamOne,其中数据范围自动重映射且颜色插值已启用。

有关可用于 showMetadata 命令的标志的详细信息,请参见技术文档的“MEL 命令和 Python 命令”部分。
使用此脚本方法,而不使用标记菜单或“元数据可视化选项”(Metadata Visualization Options),只能同时可视化两个流。