In this exercise you use rubbersheeting to correct distortions in aerial photographs.
After the image is rubbersheeted, it can serve as a valuable reference for engineering, facilities, and mapping projects. Rubbersheeting can be a low-cost alternative to orthophotography if approximate accuracy is acceptable.
In this exercise, you use rubbersheeting to correct an image involved in a parking lot project. Import control points, add additional points, explore differences between Triangular and Polynomial methods, and learn how to use the rubbersheet preview and check points to predict your results.
Related Exercises
- Exercise S7: Correcting Distortions Using Triangular Rubbersheet
- Exercise S8: Correcting Distortions Using Grid Points
Before doing this exercise, ensure that AutoCAD Raster Design toolset options are set as described in the exercise Exercise A1: Setting AutoCAD Raster Design Toolset Options.
Exercise
- In the \Tutorial5 folder, open the drawing file
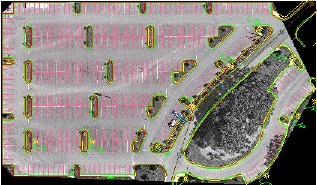
Rsheet_01.dwg. A grayscale image of a parking lot automatically inserts with the drawing.
Invoke rubbersheet and import a point file
For convenience, a point file has already been created for you to use as a starting point for this exercise. In normal practice, you create pairs of source and destination points to specify where the image must stretch to align with the vector line work. It is recommended as a best practice to export your points before executing the rubbersheet. Then if you want to try the rubbersheet operation again with a different method or with different points you have a good place to start.
- To display the
Rubbersheet-Set Control Points dialog box, click
Raster
 Correlate
 Rubbersheet.
- Click the
Import button, choose the point file \Tutorial5\Rsheet_01.txt and click
Open. The imported points display in the control point list box. The
OK and
Preview buttons are available now that there are sufficient points to perform a rubbersheet (at least 3 are required).
Preview the rubbersheet and re-pick a point
In the next few steps, you compare previews for both methods, Polynomial and Triangular. Based on the previews you re-pick any points that were incorrectly defined.
- In the Rubbersheet-Set Control Points dialog box, under Method, select Polynomial and leave the Degree at the default setting 1. The Error column shows how much the actual location of destination points, after rubbersheeting, will differ from the entered values.
- Click the
Preview button. The
Rubbersheet-Set Control Points dialog box closes and a preview of the rubbersheet is shown.
The red border previews the extents of the raster image after the rubbersheet. The cyan border shows the extents of the original image. The amount of variation in these extents indicates how much the image must be distorted to match up with the control points. The upper left and lower right corners are areas of considerable distortion.

- Right-click or press Enter to exit the preview.
- Set the
Method to
Triangular. Select the
Preview button.
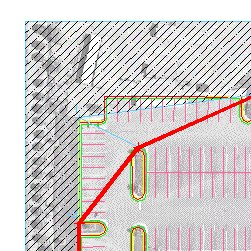
The preview shows the extents of the result in red and previews the extents of that area with a thin cyan line. The area between the cyan extents and the original frame of the image is discarded in the final triangular rubbersheeted result. The triangular algorithm can be applied only over the area contained by the control points; the rest must be discarded. Zoom into the upper left to see this more clearly. We can see from this preview that point 1 apparently has been incorrectly defined. The destination for this point should be at the corner of the parking lot, not on the round island to the right.
- Right-click or press Enter to exit the preview.
- Highlight the row for point 1 in the control point list box. Click the Repick button. The Rubbersheet-Set Control Points dialog box is closed temporarily and the screen is zoomed to the region of point 1.
- At the command line you are prompted to specify a new
Source point. Press
Enter to accept the current source point, which is the blue point just above the corner of the yellow vector perimeter. You are now prompted to specify the new
Destination point. Pick the point at the corner of the yellow perimeter. This action moves the destination point from the round island to the corner of the parking lot.

The Rubbersheet-Set Control Points dialog box is displayed after you pick the new destination point.
Add control points for triangular rubbersheet
As you saw in the Triangular rubbersheet preview, the final result includes only that portion of the image contained by the control points. To get a rubbersheeted image that covers the whole parking lot, you need to add several control points.
- Click Preview to see where control points need to be added. Note the areas in the upper left, lower left, and lower right of the parking lot where the wide red border deviates significantly from some parts of the parking lot. You can add a control point in each of these areas to correct this situation. Press Enter to exit the preview.
- Click
Add Points. At the command line you are prompted to specify a new
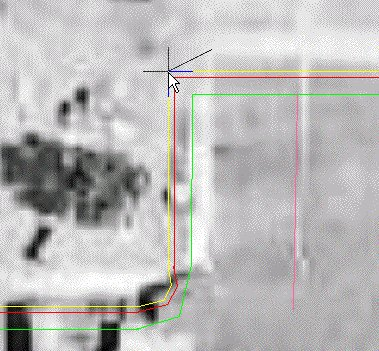
Source point. Transparently zoom to the upper left corner of the project. Pick the upper corner of the parking lot in the image. At the command line you are prompted to specify the
Destination point. Pick the corresponding corner represented by the yellow border.
- At the command line you are prompted to specify the next
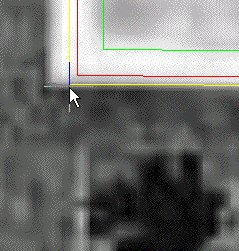
Source point. Transparently pan and zoom to the lower left corner of the parking lot. Similar to before, pick the corner of the parking lot in the image as the
Source point and the corner of the yellow border as the
Destination point.
- At the command line you are prompted to specify another
Source point. Transparently pan and zoom to the lower right corner of the parking lot. Locate the light pole labeled in the drawing. Notice the image and drawing line up closely at this point so you can make this an anchor point where the
Source and
Destination points are the same. Pick the light pole and then enter
a to anchor the point. Enter
d to finish adding points and return to the
Rubbersheet-Set Control Points dialog box.

- Click the
Preview button. Notice that the whole parking lot is now contained within the red image boundary as desired. Right-click or press
Enter to exit after examining the preview.

Preview polynomial rubbersheet
Now that all the control points are in place, see how a Polynomial rubbersheet would look. Often you find that the Triangular method gives just the results desired but there may be other cases where the Polynomial method would be the better choice. One case might be where you might need to preserve the image data outside the area of known control points.
- In the
Rubbersheet-Select Control Points dialog box, under
Method, select
Polynomial. Leave the Degree at 1. Click the
Preview button to see the projected results.
Note that the outline of the image would change very little from its present form. This means the rubbersheet operation will introduce very little distortion and the data outside the control points is reasonable.

- Press Enter to close the preview window.
- Note the errors reported for the individual control points in the Error column of the Rubbersheet-Set Control Points dialog box. All are under 2 feet and some are under a foot. Note the Total RMS Error which is a form of an average error of all the points.
- Raise the polynomial Degree to 4 to see how this affects the individual and Total RMS Error as well as the preview. The individual errors and the Total RMS Error drop significantly. Leave the degree at 4.
- Click the
Preview button to see how the higher degree affects the overall image.
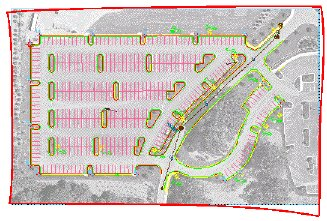
Significant warping is now present in the red new image outline. The higher polynomial degree allows greater warping in order to match the control points more closely. The result is dramatic warping in areas where there are no control points. This degree of warping renders the image useless for those areas outside the control points.
- Right-click or enter
Enter to exit the preview.
Add check points
You have seen that for the polynomial method there is an inverse relationship between control point error and the amount of warping present in the image. This relationship is affected by polynomial degree as well as by the number and arrangement of control points.
Another tool for evaluating this relationship is the check point. A check point is a control point that is disabled so it is not included in the calculation of the image transformation. Instead, the distance that point is moved, based on the control points used, is reported in the error column. In this way, you can get a quantitative measure for the extent that image warping occurs in a specific part of the image. While you explore check points in the context of a Polynomial method rubbersheet, they are equally useful for evaluating movement between control points for Triangular method rubbersheets.
- Click the Add Points button and set anchor points at each corner of the image frame. (Anchor points are not necessary for this use but are cleaner and easier to define). Point numbers 17, 18, 19 and 20 are defined when you are done. Type d when you are finished adding points. The Rubbersheet-Set Control Points dialog box displays.
- In the Rubbersheet-Set Control Points dialog box, clear the check boxes for points 17, 18, 19, and 20 to disable them. These check points display gray in the control point list box. The error calculation is dynamically updated as you enable or disable control points.
- With the four points now set as check points, the Error column values for these points show exactly how far the corners of the image move in order to accomplish the warp using the defined control points and the polynomial
Degree of 4. Change the
Degree to 1 and note that the check point movement is significantly less.
Perform the rubbersheet
You have explored the possibility through previews and check points of performing this rubbersheet using the Triangular and Polynomial methods. You have also seen the advantages of changing polynomial degree and adding more control points. The Triangular method will be used for the final rubbersheet because there are no errors at the defined control points, and the image data outside the parking lot boundary (the control point cluster) is not required.
- In the Rubbersheet-Set Control Points dialog box, change the Method to Triangular.
- Export the control points in case you want to repeat the rubbersheet later using different settings. Click the Export button, then in the Export dialog box name the file Rsheet_01new.txt, and click Export.
- Click
OK. The rubbersheet processes and the
Rubbersheet-Set Control Points dialog box closes. Enter
REGEN to correct the display order if necessary.
- Close the drawing without saving any changes to the drawing or image.