In this exercise, you learn how to create a fitted contrast curve and apply it to different parts of an image.
The fitted contrast curve provides detailed control over tonal adjustment. You can place up to 16 control points through which a smooth curve is automatically drawn. You can adjust the image by moving, adding, or deleting control points. The curve is constrained so that for each possible input value in the selected area, only one new output value is established.
Related Exercises
Before doing this exercise, ensure that AutoCAD Raster Design toolset options are set as described in the exercise Exercise A1: Setting AutoCAD Raster Design Toolset Options.
Exercise
- In the \Tutorial8 folder, open the drawing file
TonalAdjustment03.dwg. The drawing automatically inserts the image properly correlated. If necessary, enter
REGEN to see the vector data on top of the image.
Start tonal adjustment
- Click
Raster menu
 Image ProcessingHistogram. Enter
e (Existing) to indicate that you will use an existing closed vector entity to define a sub-region for analysis.
Image ProcessingHistogram. Enter
e (Existing) to indicate that you will use an existing closed vector entity to define a sub-region for analysis.
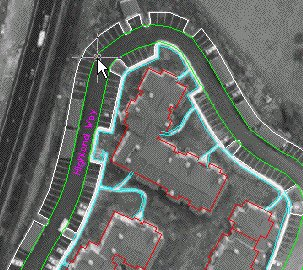
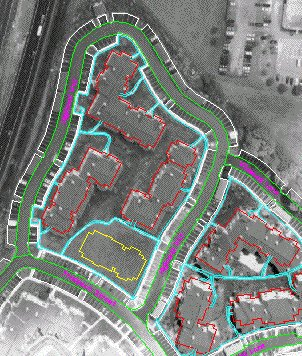
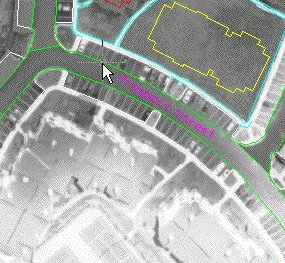
- The streets in the project are outlined in green. Pick on the green street outline for Highland Way.
- In the Histogram dialog box, click the Tonal Adjustment tab.
- In the
Select Curve Type box, select
Fitted.
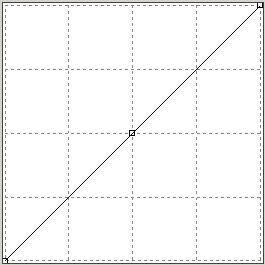
The straight line in the contrast window indicates the initial linear relationship between input tonal values from the image across the bottom (black on the left, white on the right) and their corresponding display values on the vertical (black at the bottom, white at the top). Because of this relationship, moving the line up and down uniformly tends to change the brightness of all the values. Similarly, changing the slope of the line tends to change the contrast for all the values. But if we make the graph non-linear and manipulate several control points, we can change the output brightness and contrast for different ranges of input tones in the image.
Our goal is to even out the tones contained in the roadway. We can refer to the preview display while making adjustments. We want to make the curve flatter over the values of interest in order to decrease the contrast between lighter and darker values. This is best accomplished by adding another control point to the right of the middle one.
- Click in the curve window above the existing middle control point, between the graphed line and the right side of the window.
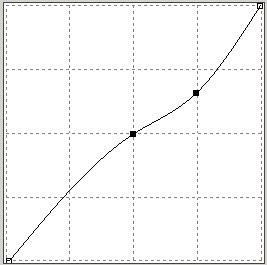
The roadway still shows too much contrast along its length. We need to make the curve flatter for the higher whiter values.
- Move the right control point up to a spot near 245,210. The double inflection in the curve is not a critical factor for this type of enhancement.

Export the curve to use in other road sections
- Click Export to display the Export dialog box. Set the directory to \Tutorial8. Enter Tutorial03 for the filename and leave Gamma Point List (*.gpl) as the file type. Click Export.
- Click Apply to update the imagery for Highland Way. Click Close.
- Enter
REGEN.
Apply the curve to Wildwood Lane
- Click
Raster menu Image ProcessingHistogram. Enter
e (Existing).
- Select Wildwood Lane as the connected entity in which to apply the tonal adjustment.

- In the Histogram dialog box, click the Tonal Adjustment tab, and ensure that the curve type is set to Fitted.
- Click
Import. Set the directory to Tutorial8 and select the file Tutorial03.gpl. You should see the same curve we used for Highland Way. Click
Apply and then
Close. The two streets Highland Way and Wildwood Lane should appear very similar in tone in the resulting image.

Apply the curve to Prospect Street
- Click
Raster menu Image ProcessingHistogram. Enter
e (Existing).
- Select Prospect Street as the connected entity in which to apply the tonal adjustment.
-
- In the Histogram dialog box, click the Tonal Adjustment tab, and ensure that the curve type is set to Fitted.
- Click
Import. Set the directory to Tutorial8 and select the file Tutorial03.gpl. You should see the same curve we used for Highland Way and Wildwood Lane. Click
Apply and then
Close. All the streets and indeed the whole project should now appear with proper image tone.

- Close the drawing without saving changes.