Focusing on slice stacks, changing their appearance, and browsing through the layers
 Slices section in the
project tree, or any of the slice stacks within, is selected to have access to the necessary menu options.
Slices section in the
project tree, or any of the slice stacks within, is selected to have access to the necessary menu options.
Jump to:
- To view slices
- To modify display color and name of slice stacks
- To view slice outbox, path corners, slice filling, and path directions
- To scroll through the layers
- To animate the toolpath
- To view area statistics over all layers
To view slices
- Use the mouse scroll wheel to zoom in and out, and click and hold the middle mouse button to pan.
- Use the menu options in for changing visibility of all or selected slices.
- From the main menu, choose from
 All slices,
 Selected slices, or
 Selected Area as needed.
-
 To toggle the visibility of the background grid, choose
 View > Show grid.
To modify display color and name of slice stacks
Select the slice stack or stacks to change, then choose
Edit >  Rename and
Edit >
Rename and
Edit >  Change Display Color to change the stacks as needed.
To view slice outbox, path corners, slice filling, and path directions
You can switch these elements individually per slice stack. As such, their display toggles are only available through the slices' context menus.
-
Outbox
A rectangular frame conforming to the maximum expansion in X and Y of all slices in a stack.
-
Points
Points mark locations where the toolpath changes direction, or where hatches begin and end.
-
Interior
Highlighting the interior fills the area enclosed contours with a placeholder pattern but it is not actually a toolpath. The highlighting style can be configured in Netfabb's settings.
-
Directions
Toolpath directions are visualized by a coloring the toolpath between points with a gradient from black (beginning) to the slice's display color (end) as well as a small (approx. 0.4 mm) arrow.
- Right-click the slice stack you want to change the display of.
Tip: Have multiple slice stacks selected beforehand to change the visualization for all stacks at once.
- From the appearing context menu, choose any of the options Show Outbox, Show Points, Show Filling, Show Directions.
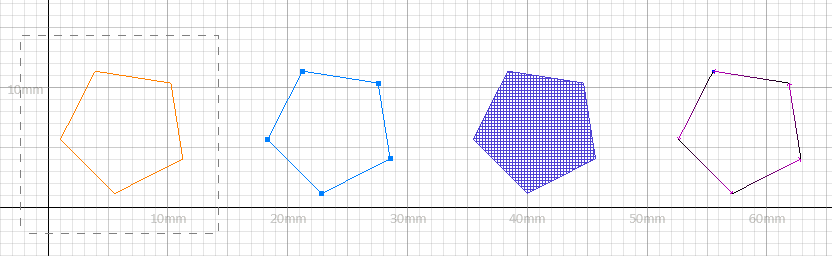
From left: Outbox, corner points, highlighting, and hatch directions. Note the scale.
To scroll through the layers
The context view holds a vertical slider along its left border. Use it to scroll through the layers, or use the Play button to scroll up and down automatically.
While dragging the scrollbar, the display is not updated if Preview Calculation is checked. To watch the result of preliminary calculation while scrolling, uncheck the option. To see the actual result, choose Apply Calculations from the context menu, then uncheck the option. However, note that this removes the parametricity of the derived slice stack, meaning that it becomes its own, new slice stack, and if you need to change the settings of its creation, you must generate a new stack with the new settings and delete the one you generated earlier.
TopTo animate the toolpath
Animating the toolpath draws the individual contours and hatchings across all involved parts in the current layer in sections instead of drawing the entire slice layer with all contours and hatchings at once.
 Hidden slice stacks are skipped during animation.
In the context view, tick Animate Toolpath, then click the Play button.
TopTo view area statistics over all layers
Once the
Slices section contains slices you can display a graph showing the distribution of area occupied by closed contours. It shows the same value as the context view for
Area.
Toggle the statistics view in the main menu through
View > Show Slice Statistics.

The areas of the individual slices, graphed across all involved layers, for the Cartoon House part from the part library
Some actions change the total amount of area covered, such as scaling, adding or removing a slice stack, point reduction, and so on. In such cases, a recalculation is required. However, as this can take a while, it is not done automatically. To indicate that an action might have changed the area, the button becomes available; for all other actions the button remains inactive.
You can export the slice statistics to a CSV file, listing each slice with its area.
Top