What is slicing, how is it handled in Netfabb for machine-agnostic buildrooms, and what are the UI elements to work with
Slicing dissects a three-dimensional part into 2.5-dimensional information, a collection of two-dimensional layers with a defined thickness, also known as a slice stack. It also processes the slice information to generate the toolpaths, or exposure patterns, for the actual additive method – bitmap or vector images, essentially.
Jump to:
Slicing in Netfabb
There are two main ways to slice in Netfabb:
- For the slicing done automatically with machine-specific parameters, refer to the machine workspaces.
- For manual, machine-independent slicing, any plain buildrooms without a machine engine (without "process parameters") have a Slicing section in the project tree. This section of the online help covers the machine-independent slicing.
Netfabb also reads or imports certain vector slice files. However, this only imports geometric information; data such as laser power and speed is dropped.
Depending on the complexity of the model, performing some modifications at the slice level, rather than the mesh level, can be significantly faster due to the simpler nature of the involved dataset.
Slicing in Netfabb is also parametric: Until you apply the calculations, intermediate steps with an effect on later ones can be modified without losing work on those later steps.
General workflow
- Drag and drop parts into
Slices in the project tree, or use
Slice parts from the main menu of a build platform. This generates the contours ("profile", "hull") from parts and support.
Tip:
 For supports, open and closed supports generate separate slice stacks to allow dedicated toolpath generation.
Alternatively, select the Slices section and directly load a slice file with the contours only, using Open slice file from the main menu.
- Optionally, arrange the contours on the platform using the outboxes as a guide.
Note: This is agnostic to the platform size where the respective parts originated and what target the target platform size is. The buildroom dimensions are only displayed as a guide. Unless adjusted in the slice export, the exported slice files are sized to the minimum necessary dimensions to enclose all present outboxes over the entire slicing height.
- If you're using a vector-based exposure (for a traveling laser or electron beam, for example), generate new slice stacks for hatching ("infill", "core").
- Optionally, define slice parameters like laser power and speed for the various slice stacks.
- Export the slice stacks, containing the toolpaths, in the desired format.
Controls and UI elements overview
-
Main menu
For file operations, selecting and viewing slices, and editing them
-
Project tree
Lists the individual slice stacks and groups thereof. Context menus are available, both for slice stacks as well for the Slices section itself. Each generic, or buildroom-only platform, has its own Slices section with an outline of the respective build platform.
-
Context view
Provides size and height information as well as playback controls for the slice and toolpath animation.
-
Slice analysis view
This dockable view shows the distribution of area enclosed in contours across the entire sliced buildroom. (Hatches are ignored.)
-
Display
Graphical representation of the slices, and also provides access to context menus.
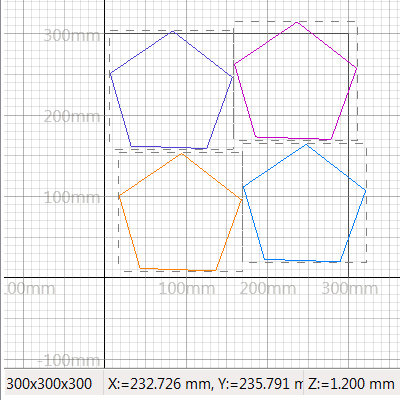
The display shows labeled axes, outboxes as dashed lines, an auto-scaling grid, and the corresponding platform's outline in addition to the various slice contours. At the bottom you see the platform dimensions as well as the current mouse pointer coordinates and the z-height of the currently displayed slice.
-
Context menus
Right-click slices in the project tree or in the display, as well as empty places in the display, to access selection and viewing options as well as slice manipulation and management commands.
Right-click the respective Slices section itself to access detailed slice time statistics in table and chart representation across the slices and to manage the default properties and their values for new slice stacks.
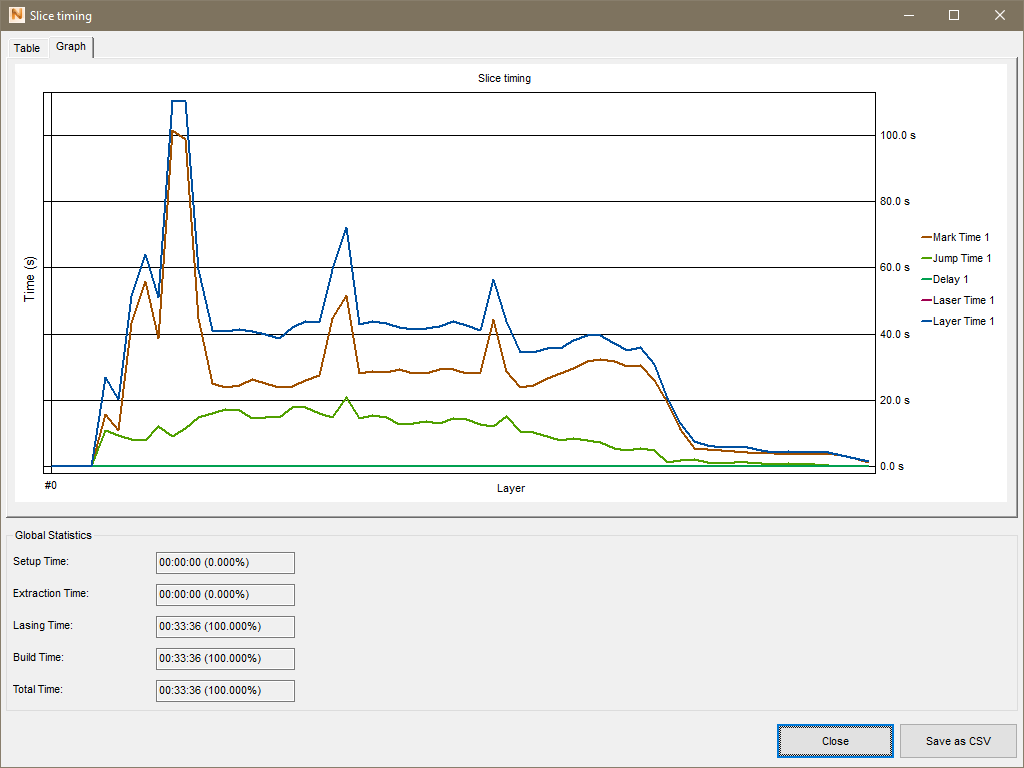
Use the slice timing analysis to identify phases of high and low utilization. Hover the mouse pointer over items to highlight the associated curve, and click on items to toggle their visibility.
-
Settings
At
 Settings > Settings > Slice Commander, you adjust colors, the style for the placeholder infill pattern for contours, as well as the default point reduction tolerance.