Introduction
In this exercise, we will perform a dynamic frequency response analysis simulation on our muffler model. This exercise builds on the changes made in the previous exercise about modal avoidance. The model supplied for this exercise includes those changes so the previous exercise is not a pre-requisite for this exercise.
1. Open the Model and Start the Autodesk Inventor Nastran Environment
Start Autodesk Inventor, and open Muffler&Brackets.iam from the Section 25 - Muffler - Frequency Response Analysis sub-folder of your training exercises folder. (Get Started > Launch > Open)
From the ribbon, click Environments, and Autodesk Inventor Nastran.
2. Set up the Modal Frequency Response Analysis
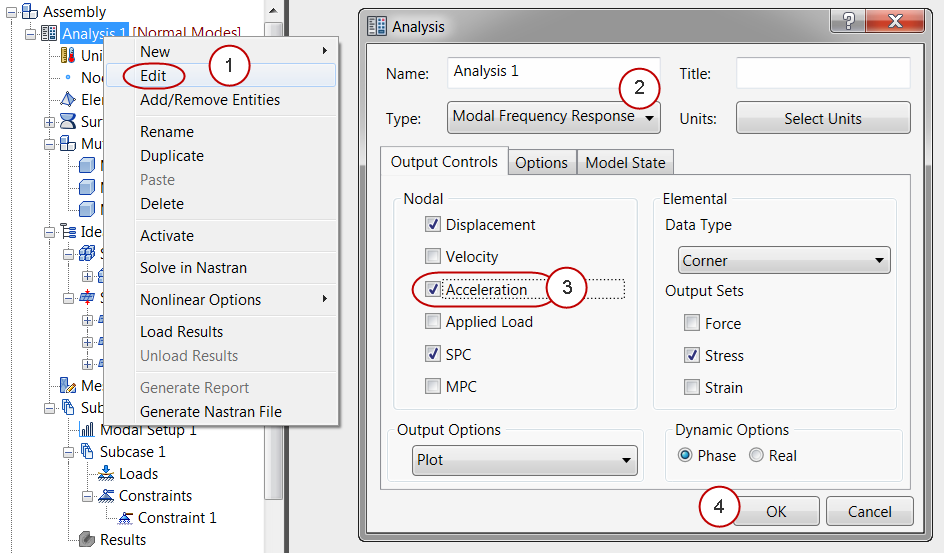
- From the Assembly Tree, right-click on Analysis 1, and click Edit.
- Set the Type to Modal Frequency Response.
- Check Acceleration.
- Click OK.
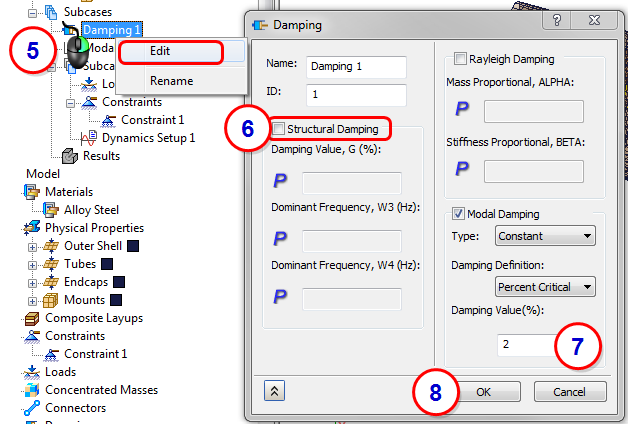
- From the Subcases branch, right-click on Damping1, and click Edit.
- Uncheck Structural Damping.
- Enter a Damping Value of 2%.
- Click OK.
3. Confirm Modal Setup
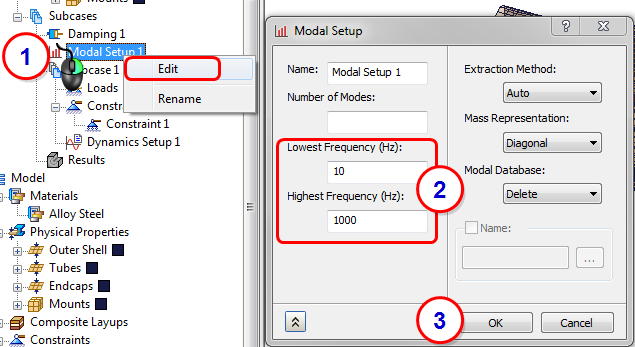
- Right-click on Modal Setup1, and click Edit.
- Verify that the Lowest Frequency is 10 Hz. Verify that the Highest Frequency is 1000 Hz.
- Click OK.
4. Create the Load
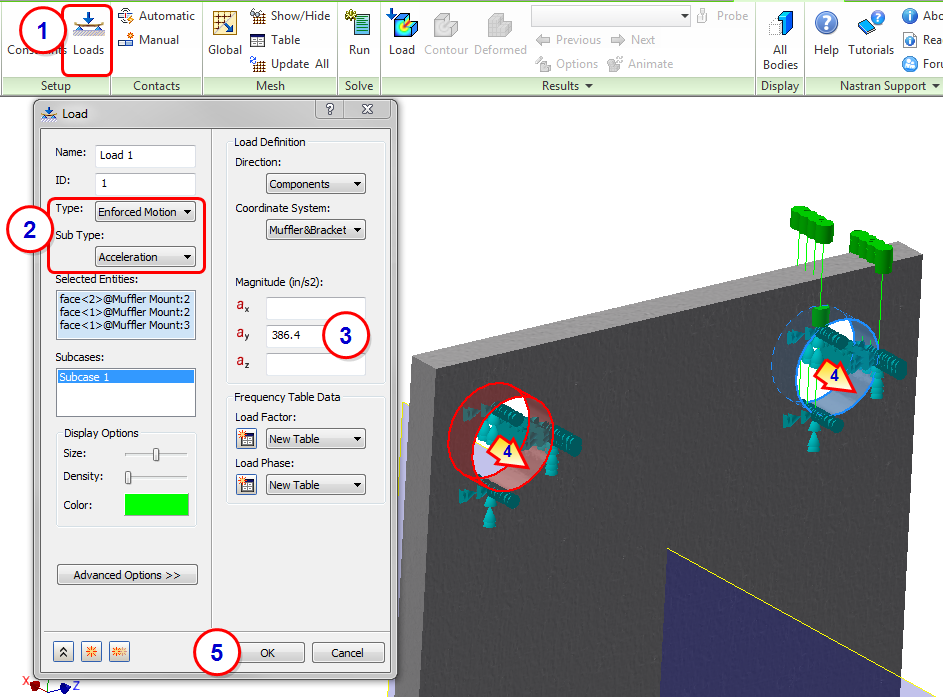
- Click the Loads command in the ribbon.
- Set the Type to Enforced Motion, and set the Sub Type to Acceleration.
- Enter a value of 386.4 for ay. (Note that this equals 1 G.)
- Apply the load to the cylindrical surface of each holes on the two brackets. (Four surfaces in total.)
- Click OK.
5. Define the Dynamic Setup
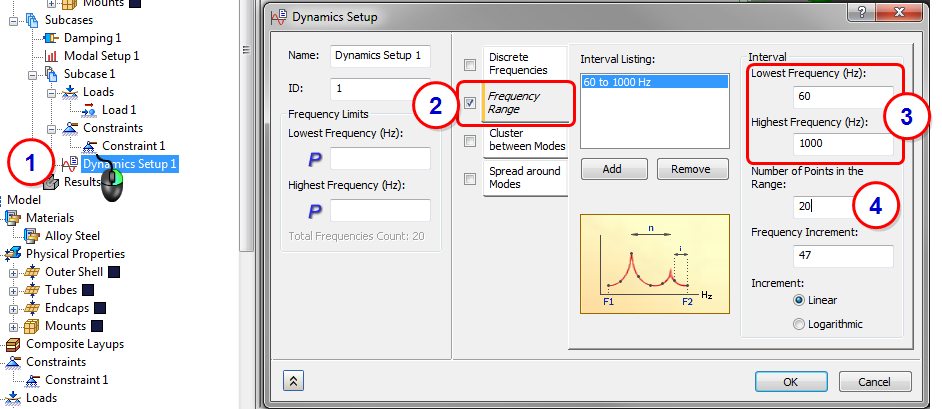
- Right-click on Dynamics Setup1, and click Edit.
- Check Frequency Range.
- Set the Lowest Frequency to 60 Hz, and the Highest Frequency to 1000 Hz.
- Set the Number of Points in the Range to 20.
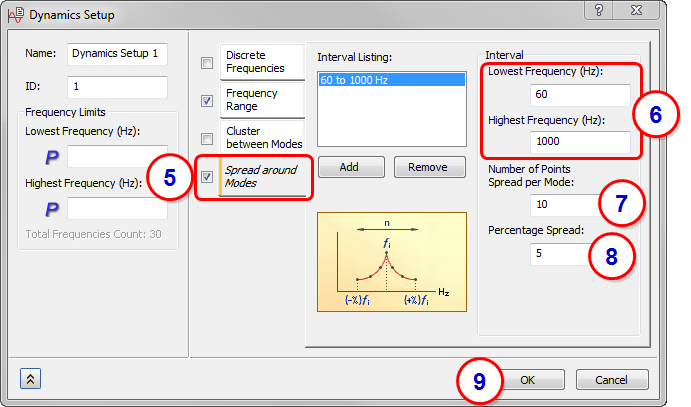
- Check Spread around Modes.
- Again, set the Lowest Frequency to 60 Hz, and the Highest Frequency to 1000 Hz.
- Set the Number of Points Spread per Mode to 10.
- Set the Percentage Spread to 5.
- Click OK.
6. Run the Analysis
Click Run from the ribbon to start the analysis.
7. Review the Results Plots
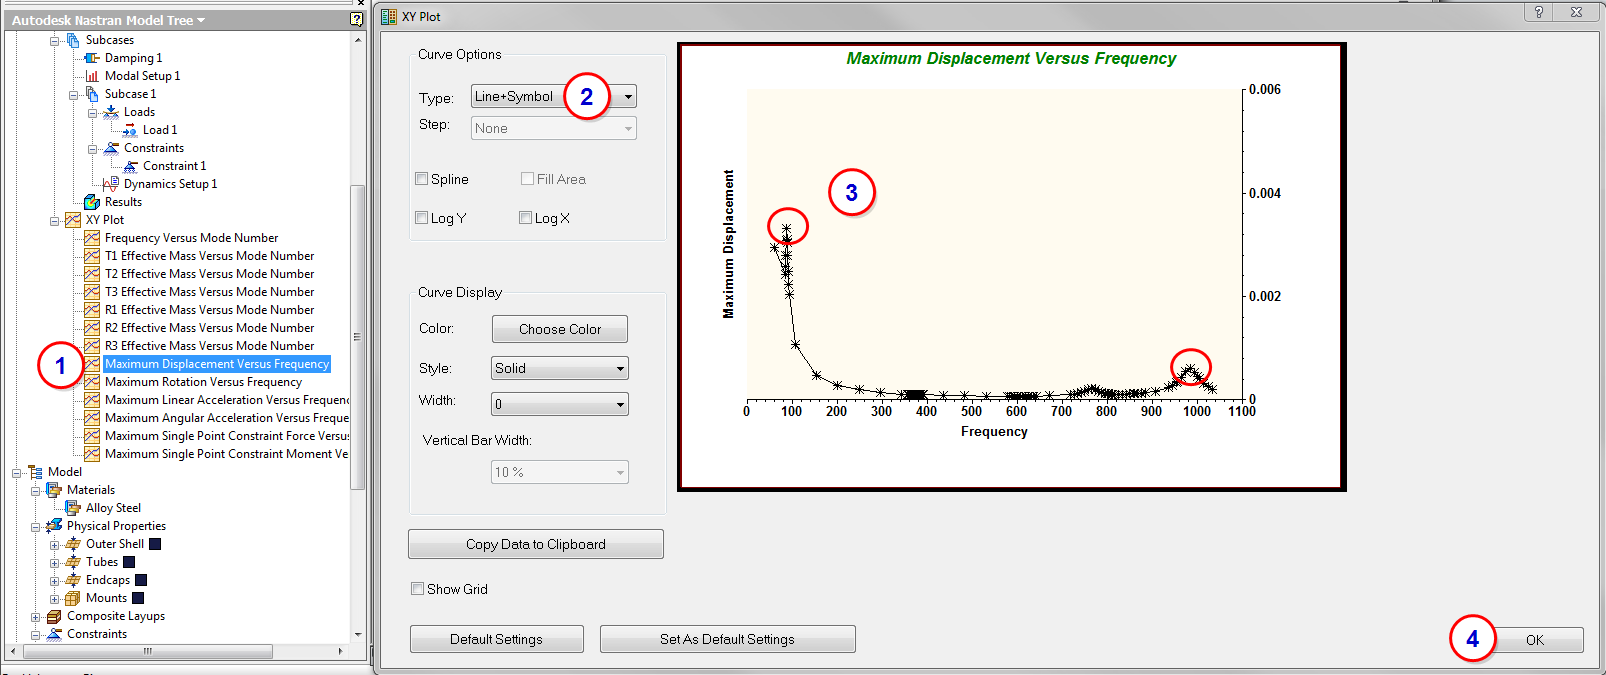
- When finished, double-click the Maximum Displacement Versus Frequency plot from the Analysis tree.
- On the Plot dialog, set the Type to Line+Symbol.
- Identify the critical modes.
- Click OK.
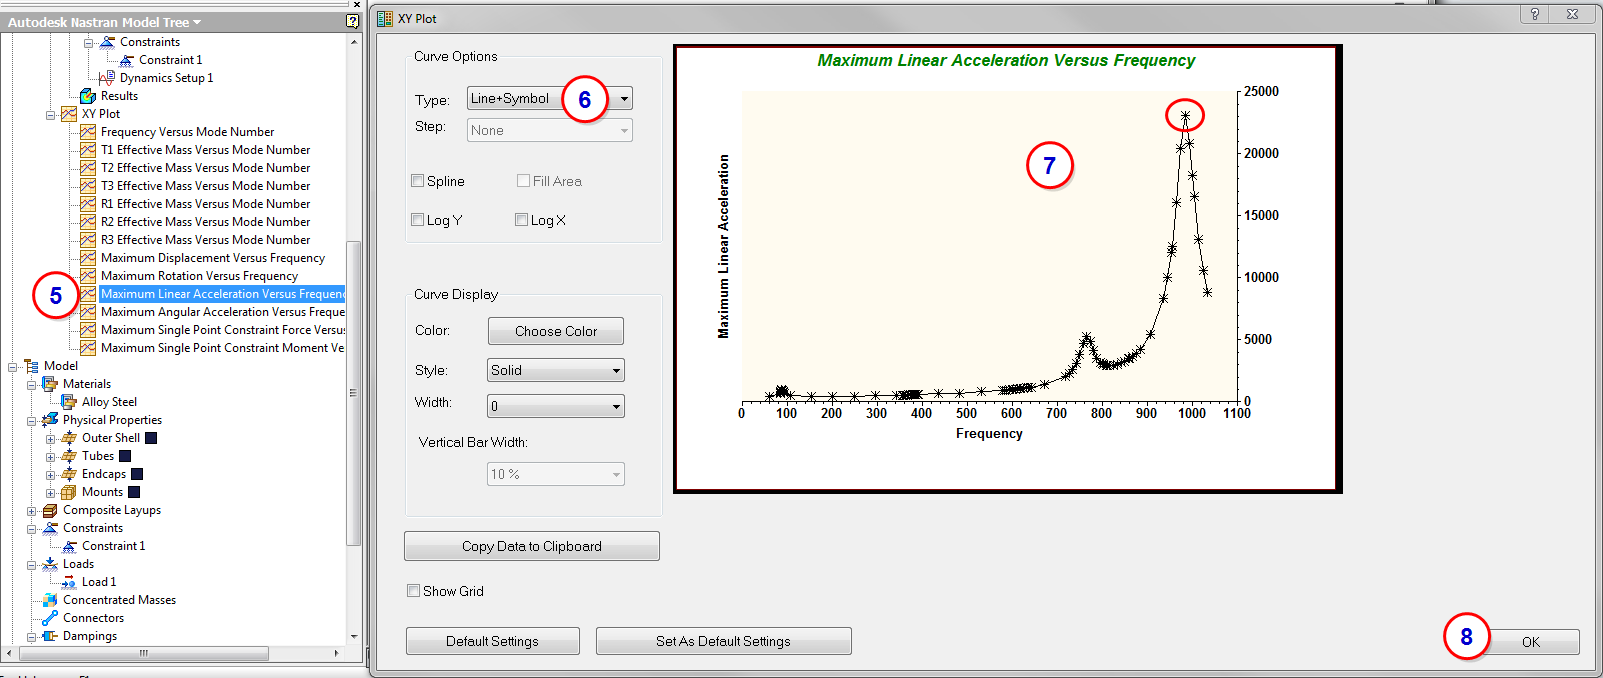
- Double-click the Maximum Linear Acceleration Magnitude Versus Frequency plot.
- On the Plot dialog, set the Type to Line+Symbol.
- Identify the critical modes.
- Click OK.
8. Review the Results
- Click Options from the Results panel in the ribbon, or in the Analysis tree, right-click .
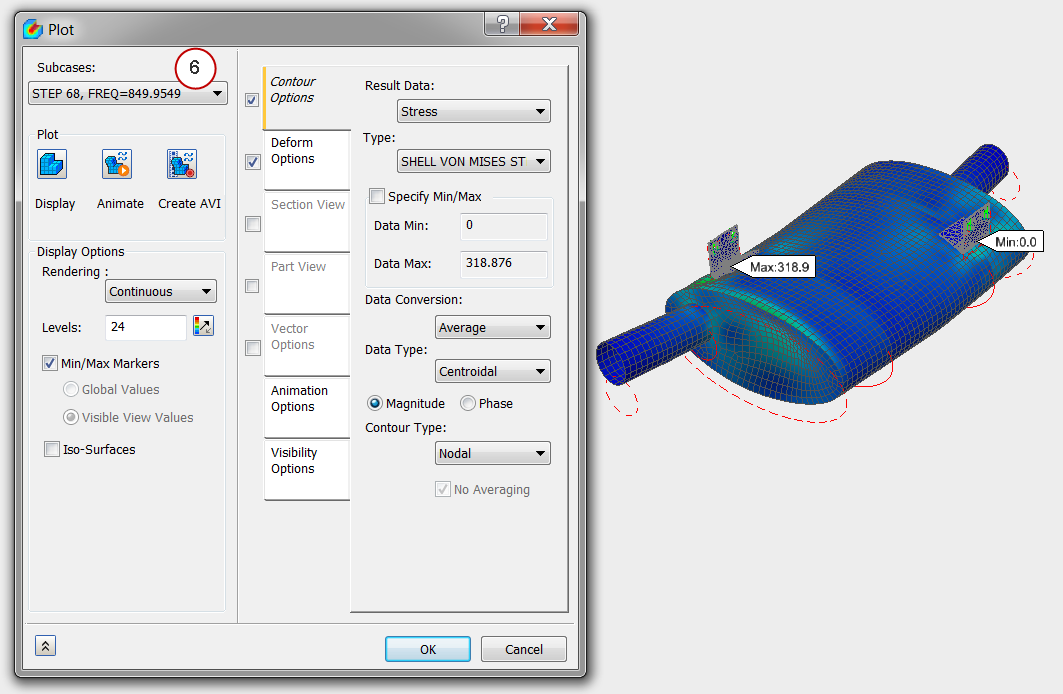
- Select Stress from the Result Data menu, and SHELL VON MISES STRESS from the Type menu.
- Select STEP 6 from the Subcases list.
- Click Animate to examine the motion of the muffler.
- Examine the areas of highest stress.
- Repeat the process for the other critical frequencies.

Summary
In this exercise, we shook the muffler with the road load inputs to see how much stress is expected since we still had natural frequencies in the operating range of the curve. From the resultant stress levels, we can determine if a fatigue study is required.
|
Previous Topic: Frequency Response Analysis |
Next Topic: Transient Response Analysis |