Introduction
In this exercise, we will examine the results from the last exercise, and determine if the mesh distribution played too strong an influence on our results. We will do the following in this exercise:
- Use an assortment of visualization tools to determine the quality of our analysis results.
- Refine the mesh and compare the new mesh to the one used in the previous exercise.
- Run the new mesh and examine the results.
1. Open the Model
Start Autodesk Inventor, and open refine-mesh.ipt from the Section 8 - Refine Mesh sub-folder of your training exercises folder.
Start the Autodesk Inventor Nastran environment.
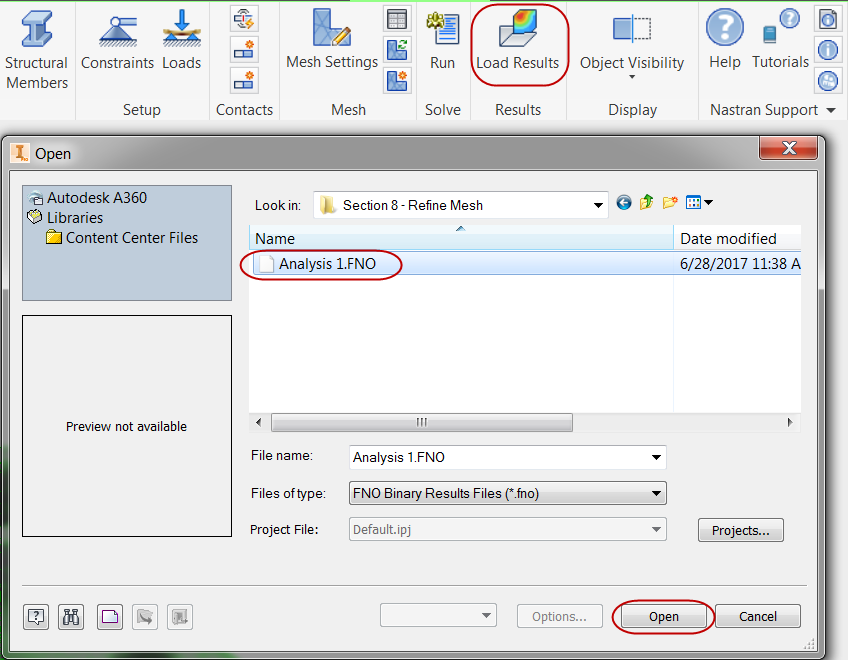
To load the results needed for this exercise, click Load Results from the Results panel, and select Analysis1.FNO, located in the Section 8 - Refine Mesh sub-folder:
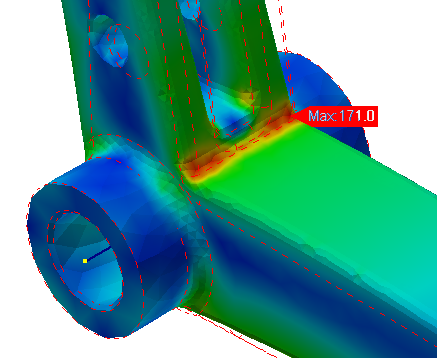
Upon close inspection, the stress results show a few indicators of potential convergence issues. The local face tangency is intermittent. In the following image, you can see that the results on the surface look "rough," and the area of high stress is "spotty."
Contour Type: Fringe vs. Continuous
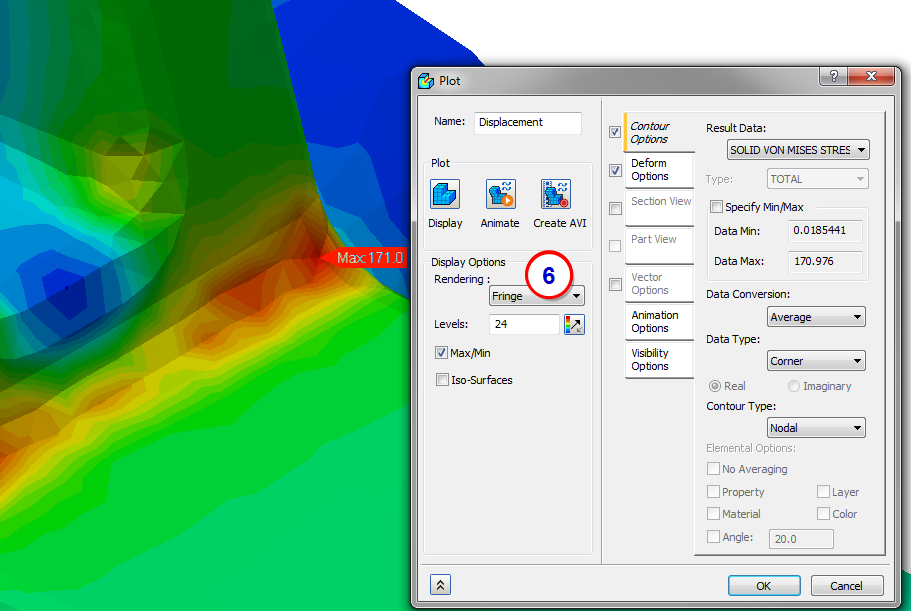
We'll start by displaying von Mises stress on the model and adjusting the rendering options:
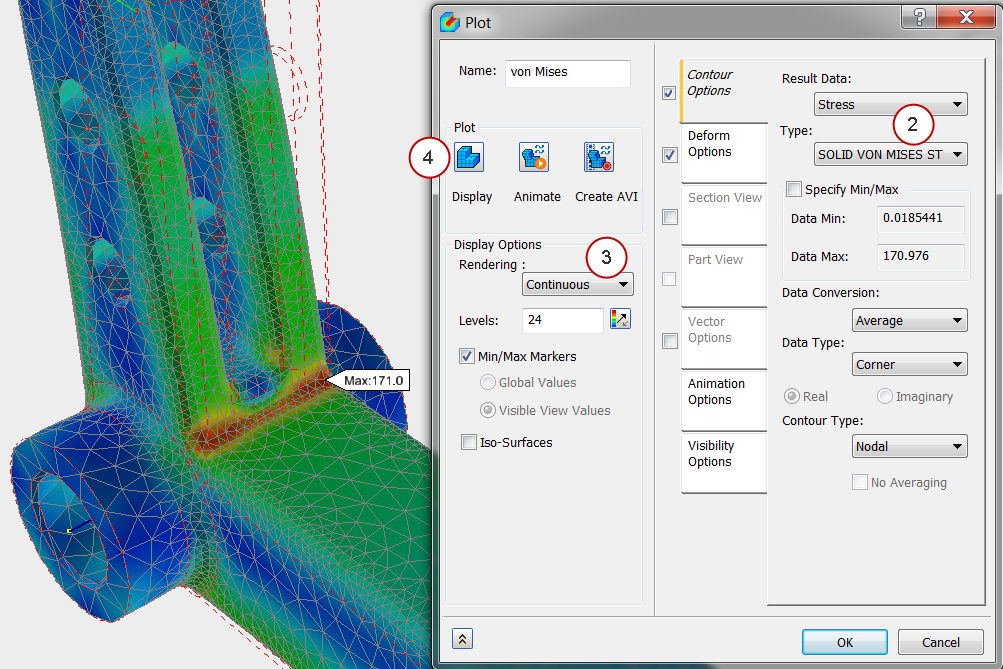
- Click Options from the Results panel.
- On the Contour Options tab, select Stress from the Result Data list, and SOLID VON MISES STRESS from the Type list.
- Set the Rendering to Continuous.
- Click Display.
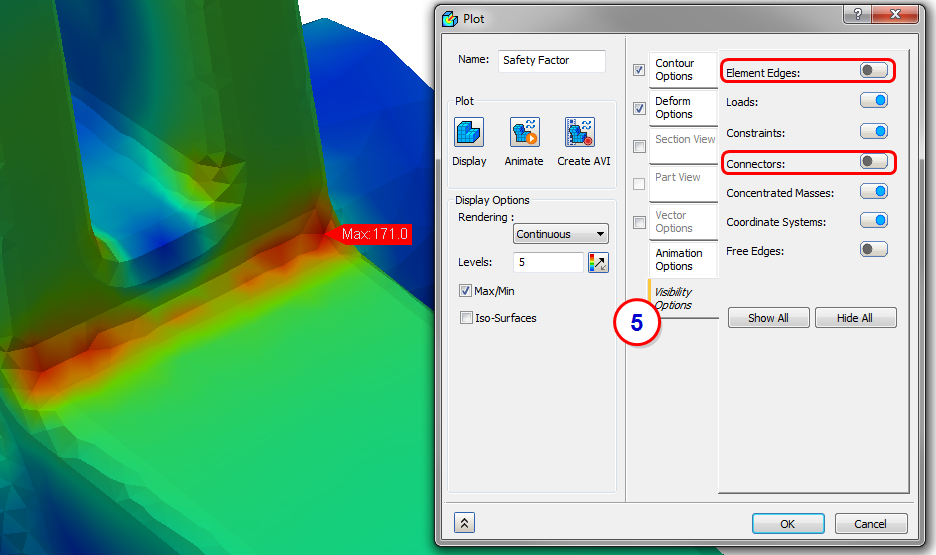
- To clean up the view, click the Visibility Options tab, and slide the controls for Element Edges and Connectors to the left:
- Change the Rendering to Fringe. You can see that the boundaries of the contours are line segments instead of curved lines, and tend to be influenced by the element edges. This indicates that we might need to refine the mesh to improve the results:
Stress Display: Averaged vs. Unaveraged
- Click the Contour Options tab again. From the Data Type list, select Centroidal.
- From the Contour Type list, select Elemental.
- From the Elemental Options section, select No Averaging.
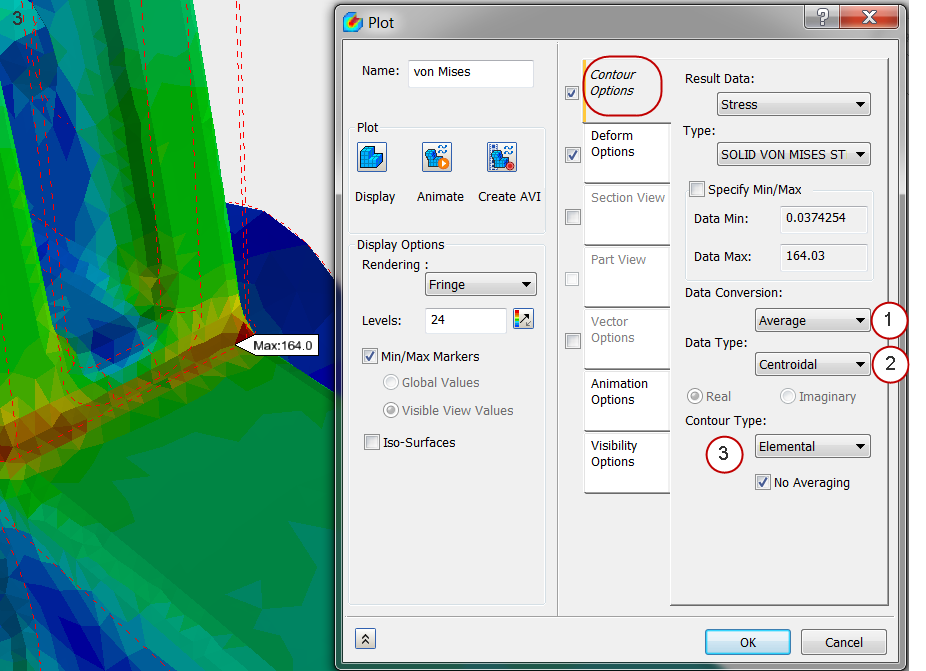
Note that the unaveraged centroidal plot shows large jumps in stress across adjacent elements. This is a clear indicator that mesh refinement is needed.
2. Refine the Mesh Locally
- From the Analysis tree, right-click on Mesh Model, and click Add Mesh Control.
- On the Mesh Control dialog, set the Element Size to 0.5 mm.
- Click in the Selected Faces field.
- Select these faces from the model. There should be 9 surfaces in all:
- Click OK to close the Mesh Control dialog.


3. Change the Global Mesh Settings
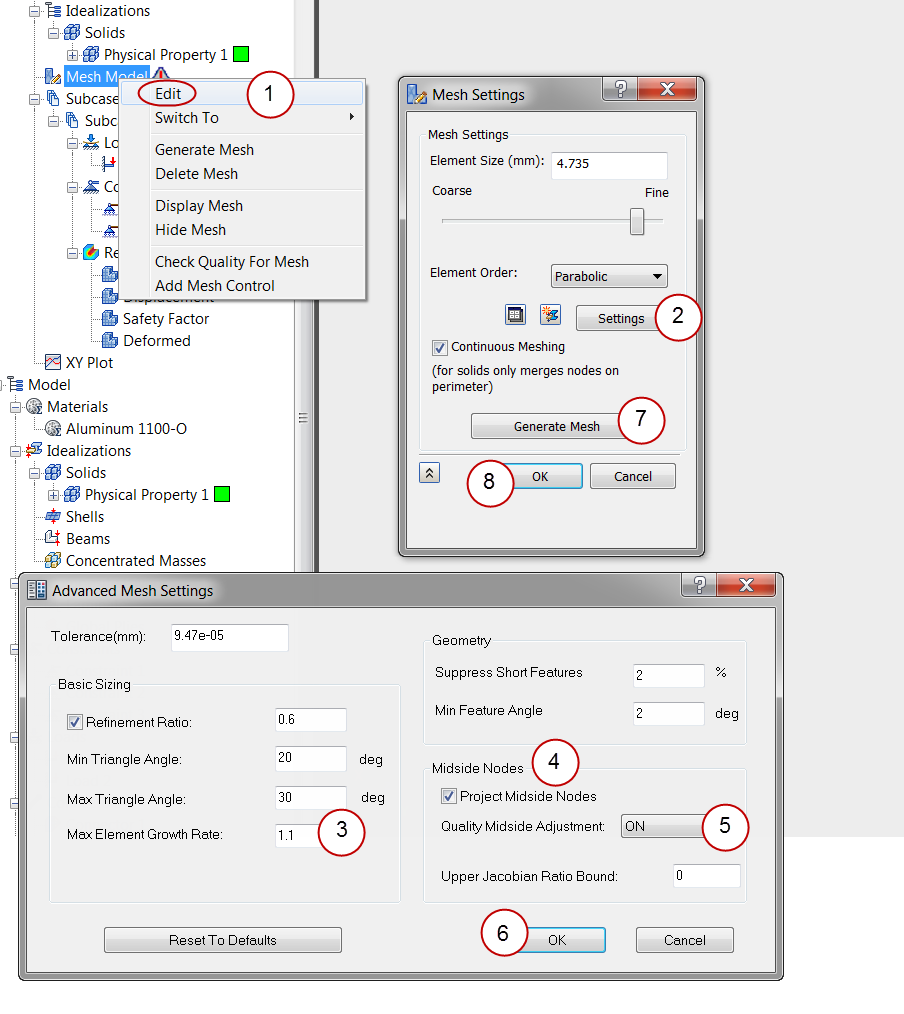
- From the Part Tree, right-click on Mesh Model, and click Edit.
- From the Mesh dialog, click Settings.
- On the Advanced Mesh Settings dialog, change the Max Element Growth Rate to 1.1.
- Check the Project Midside Nodes box.
- Set Quality Midside Adjustment to ON.
- Click OK to close the Advanced Mesh Settings dialog.
- Click Generate Mesh to re-generate the mesh.
- Click OK to close the Mesh dialog.
The original mesh is shown on the left, and the new one is on the right:

4. Run the Analysis
Click Run from the ribbon.
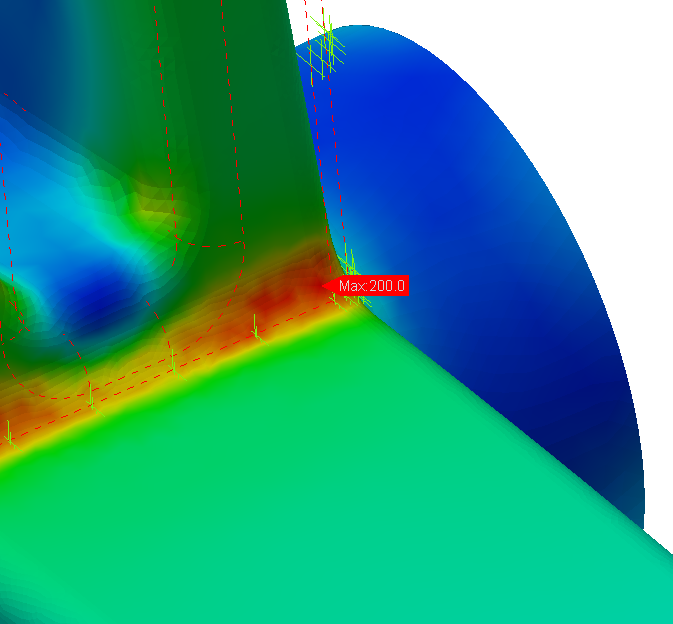
Note that the stress increased nearly 20% in this fillet:
Summary
Autodesk Inventor Nastran provides powerful tools for mesh control and refinement to enable you to get the best mesh for your design needs.
Convergence should always be checked, even if you are focusing on trend analysis. If two designs are not similarly converged, you won't know if the stress change was due to design variations or is mesh related. This could lead to bad design decisions.
|
Previous Topic: Meshing |
Next Topic: Contact Modeling |