If your program terminates due to an error, you can view a copy of the trace stack as it appeared at the time the error occurred.
Note: The Visual LISP IDE is available on Windows only.
If the Break on Error debugging option is selected, the error trace and the trace stack are identical immediately after an error occurs.
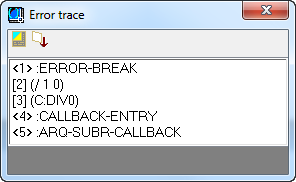
You can see en example of an error track stack by enabling Break on Error, intentionally causing an error (for example, issuing a function call that divides by zero), and opening the two trace windows.